


Our Portfolio Consulting Team monitors movements in portfolios to identify trends in investor flows and sentiment. The team looks beyond headlines to understand the true drivers of portfolio risk and opportunity. Last quarter mega-cap technology stocks and one mega-IPO dominated headlines. However, an analysis of more than 700 portfolios in our research universe told us a rather different story of where investors allocated capital.
For the 12 months ending in June (the end of our research period), international stocks returned 28%, versus 22% for U.S. stocks. For our 18-month research period, international stock returns far outpaced those of U.S. stocks. We saw this trend continue through July—strong performance in U.S. stocks, stronger performance in international markets (20% and 27% respectively).
With some consistency, portfolios in our research universe reflected an underweight to mega-cap stocks, which are largely concentrated in the U.S. market. If we look deeper within the U.S. equity allocation of portfolios, relative to the S&P 500, our analysis shows a meaningful underweight to both the Mag 7
At the same time, portfolios continue to be overweight U.S. stocks relative to international stocks. While about 37% of global equities (represented by MSCI ACWI) are domiciled overseas, equity positions reflect a strong bias towards the U.S. despite a resurgence in the performance of non-U.S. stocks.
At the same time, portfolios continue to be overweight U.S. stocks relative to international stocks. While about 37% of global equities (represented by MSCI ACWI) are domiciled overseas, equity positions reflect a strong bias towards the U.S. despite a resurgence in the performance of non-U.S. stocks.
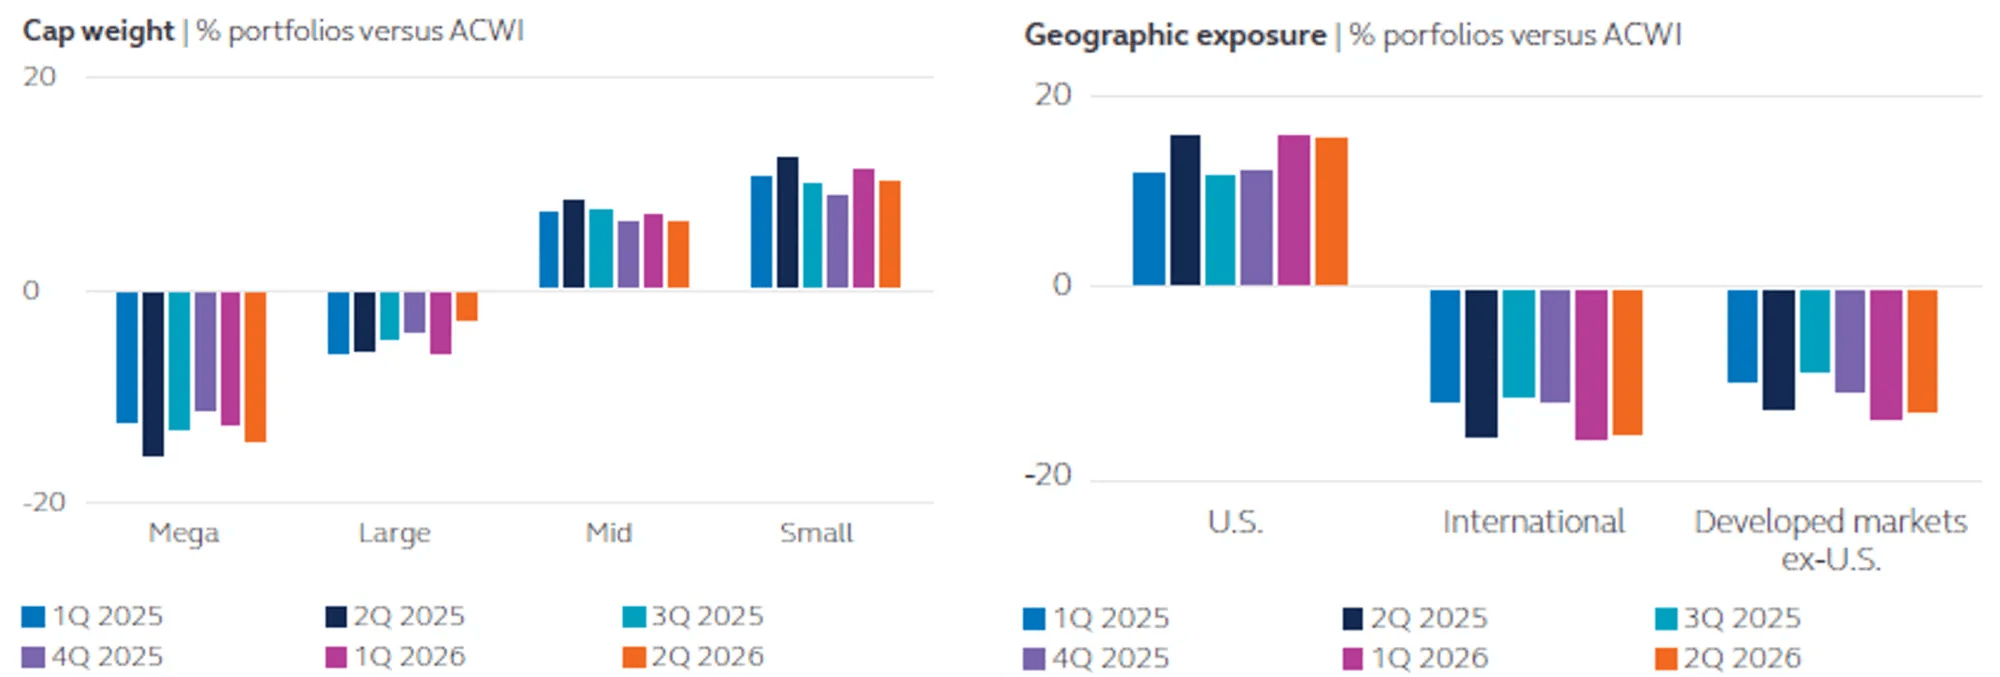
Source: Portfolio Management Team, Morningstar Direct. Date as of 06/30/2026 and based on an analysis of more than 700 portfolios from 01/01/2025-06/30/2026.
The data confirms what we hear anecdotally—exposures within U.S. equity and international allocations are created separately. As a result, today we see underweights to Mag 7 and mega-cap tech stocks within a U.S. equity allocation being mostly offset by the overweight to U.S. stocks. The question may not be whether clients have AI exposure—but whether that exposure aligns with their intended risk profile, investment objectives, and today’s opportunities.
Invest beyond borders and beyond the obvious
For investors seeking to reduce oversized tech exposure and portfolio volatility while still accessing opportunity, the answer may lie in taking a fresh look at geographic diversification. Consider replacing a portion of clients’ U.S. equity or tech allocation with the Principal International Equity ETF PIEQ or Principal International Equity Fund PINIX.
Footnotes
01/01/2026-08/20/2026. Source: Morningstar Direct.
Alphabet, Amazon, Apple, Meta Platforms, Microsoft, NVIDIA, Tesla.
For purposes of this analysis, “AI stocks” refer to a group of 42 stocks defined and identified by J.P. Morgan as companies within the S&P 500 that demonstrate meaningful exposure to the development, enablement, infrastructure, or application of artificial intelligence technologies. Direct AI (28): NVIDIA, Microsoft, Apple, Alphabet, Amazon, Meta, Broadcom, Tesla, Oracle, Palantir, AMD, Salesforce, IBM, Uber, ServiceNow, Qualcomm, Arista, Adobe, Micron, Palo Alto, Intel, Crowdstrike, Cadence Design, Dell, NXP, Fortinet, HP and Super Micro Computer. AI utilities (8): NRG, Vistra, NextEra, Southern, Constellation, Public Service Enterprise, Entergy, NiSource. AI capital equipment (6): Eaton, Trane, Johnson Controls, Quanta, GE Vernova, EMCOR.
Important information:
This material covers general information only and does not take account of any investor’s investment objectives or financial situation and should not be construed as specific investment advice, a recommendation, or be relied on in any way as a guarantee, promise, forecast or prediction of future events regarding an investment or the markets in general. Information presented has been derived from sources believed to be accurate; however, we do not independently verify or guarantee its accuracy or validity. Any reference to a specific investment or security does not constitute a recommendation to buy, sell, or hold such investment or security, nor an indication that the investment manager or its affiliates has recommended a specific security for any client account. Subject to any contrary provisions of applicable law, the investment manager and its affiliates, and their officers, directors, employees, agents, disclaim any express or implied warranty of reliability or accuracy and any responsibility arising in any way (including by reason of negligence) for errors or omissions in the information or data provided.
This material may contain ‘forward‐looking’ information that is not purely historical in nature and may include, among other things, projections, and forecasts. There is no guarantee that any forecasts made will come to pass. Reliance upon information in this material is at the sole discretion of the reader.
This material is not intended for distribution to or use by any person or entity in any jurisdiction or country where such distribution or use would be contrary to local law or regulation.
Methodology: Portfolio Intelligence is based on an analysis of more than 700 portfolios from 01/01/2025-06/30/2026. We evaluate portfolio flows, asset allocations, and positioning trends to identify broad market trends and emerging themes that may benefit advisors and their clients. Unless otherwise noted, the data reflects moderate-risk portfolios, typically consisting of 50%–80% equity exposure.
Index definitions: The MSCI ACWI captures large and mid-cap representation across Developed Markets (DM) and Emerging Markets (EM) countries. The index covers approximately 85% of the global investable equity opportunity set. The S&P 500® Index is widely regarded as the best single gauge of large-cap U.S. equities. The index includes 500 leading companies and covers approximately 80% of available market capitalization.
Bloomberg Magnificent 7 Total Return Index is an equal-dollar weighted equity benchmark consisting of a fixed basket of 7 widely-traded companies classified in the United States and representing the Communications, Consumer Discretionary and Technology sectors as defined by Bloomberg Industry Classification System (BICS).
Principal Funds are distributed by Principal Funds Distributor, Inc.
ALPS Distributors, Inc. is the distributor of Principal ETFs. ALPS Distributors, Inc. and the Principal Funds are not affiliated.
© 2026 Principal Financial Services, Inc. Principal®, Principal Financial Group®, Principal Asset Management, and Principal and the logomark design are registered trademarks and service marks of Principal Financial Services, Inc., a Principal Financial Group company, in various countries around the world and may be used only with the permission of Principal Financial Services, Inc.
Principal Asset Management® is a trade name of Principal Global Investors, LLC.
MM15024SEPT2026 | 08/2026 | 5865682-082027 | PRI002295-082027