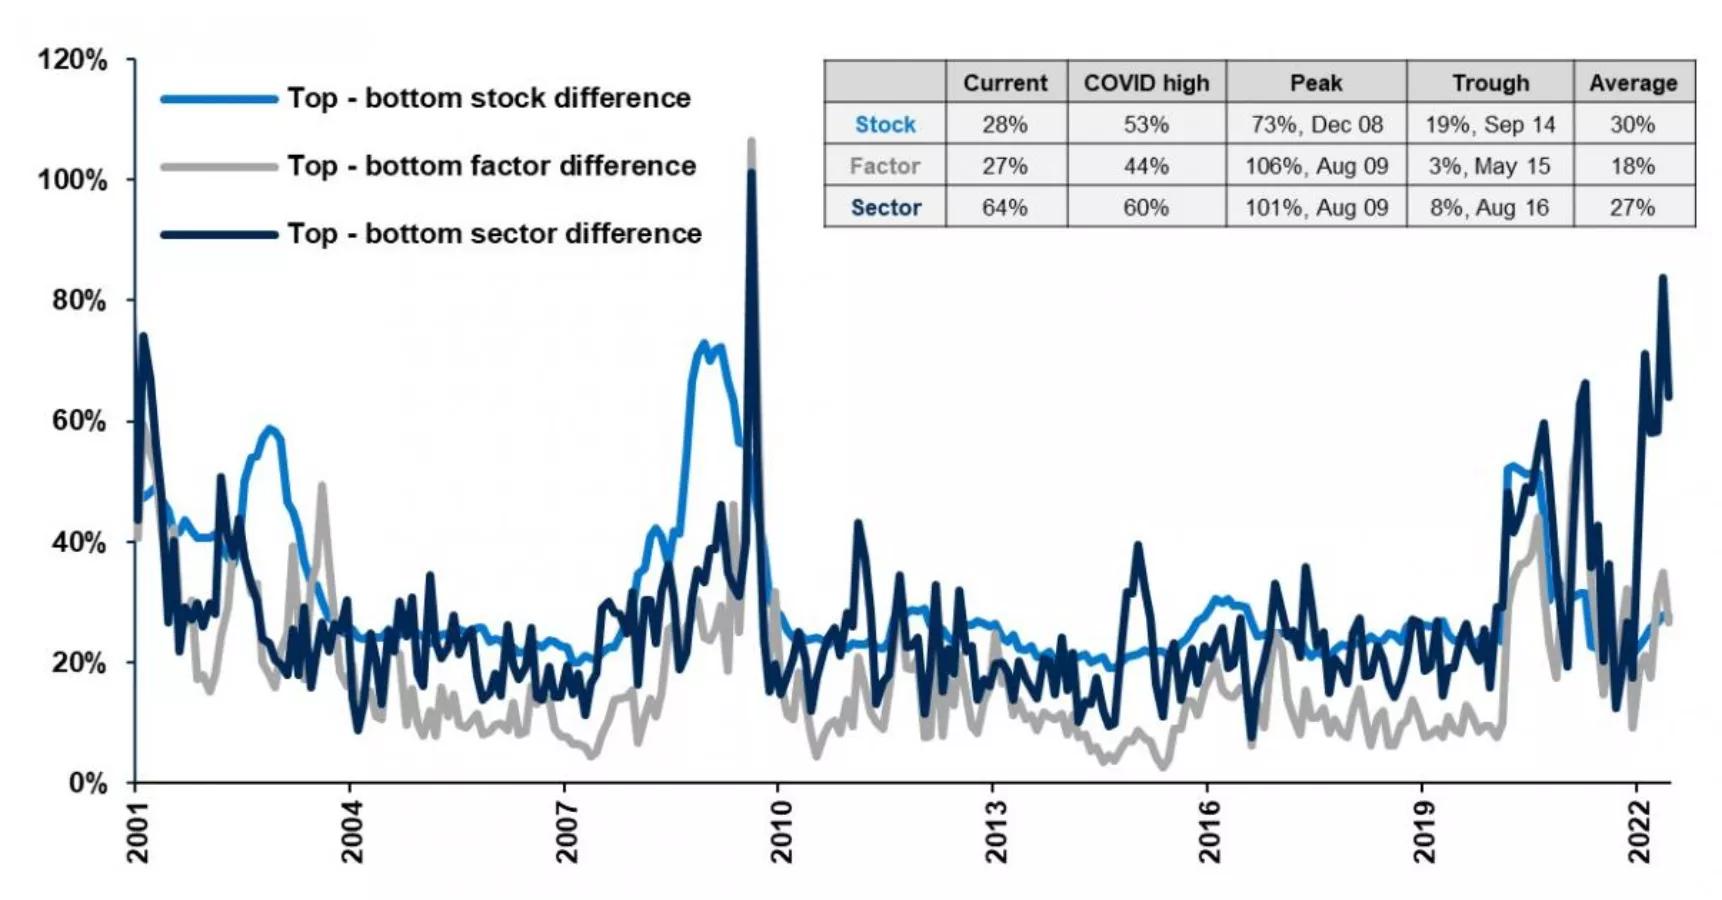
The total return gap between the top and bottom performing sectors, factors and stocks typically widens during periods of market stress. The bumpy first half of 2022 has been no exception, presenting active managers, via diligent analysis and selection, with an opportunity for potential outperformance.

Return gap between top and bottom performing stocks, sectors, and factors
S&P 500 Index, January 2001 – present

Bloomberg, Principal Global Investors. See disclosures for stock, factor, and sector gap definitions. Data as of June 30, 2022.
The S&P 500 index has dropped 20% year-to-date, almost wiping out all of its 2021 gains. Yet, while investor sentiment is undoubtedly negative, market stress is also presenting alpha opportunities for active managers.
The total return gap between the top and bottom performing sectors, factors, and stocks has historically widened during periods of market stress, magnifying outperformance potential for diligent investors who can identify the winners and avoid the losers.
In the current cycle, the combination of inflation and recessionary fears has driven a renewed widening in performance gaps:
- The dispersion in sector performance is currently at its widest point in over a decade, driven by a spectacular energy sector run, while communication services and IT have seen a broad weakening.
- The factor returns gap has also widened—high dividend stocks have been the best performing factor, while growth stocks have been the worst.
- While still historically narrow, the stock gap is rising, and at 28% is much higher than the 2021 low of 20%. Sustained market stress and volatility could send it higher.
While prolonged periods of market stress can indeed be painful for all investors, index investors don’t incur the same alpha potential that careful analysis and selection allows active managers. So, while more uncertainty is expected in the near-term, this challenging market cycle still presents investors with an opportunity for outperformance.
Stock gap: Average 180 days return of top 20% stocks in S&P 500 index minus bottom 20%.
Factor gap: Top factor index minus bottom factor index 180 days return. (Factor index: S&P 500 Growth, S&P 500 Value, S&P 500 Minimum Volatility, S&P 500 Momentum, S&P 500 Quality, S&P 500 High Dividend, S&P 500 Equal Weight, S&P 500 Buyback, S&P 500 High Beta, S&P 500 Pure Growth, S&P 500 Pure Value).
Sector gap: Top sector index minus bottom sector index, 180 days return (S&P 500 sector index).
Wall Street Journal Custom Content is a unit of The Wall Street Journal advertising department. The Wall Street Journal news organization was not involved in the creation of this content.
Investing involves risk, including possible loss of principal. Past performance is no guarantee of future results and should not be relied upon to make an investment decision.
The information presented has been derived from sources believed to be accurate; however, we do not independently verify or guarantee its accuracy or validity. Any reference to a specific investment or security does not constitute a recommendation to buy, sell, or hold such investment or security, and does not take account of any investor’s investment objectives or financial situation and should not be construed as specific investment advice, a recommendation, or be relied on in any way as a guarantee, promise, forecast or prediction of future events regarding an investment or the markets in general. The opinions and predictions expressed are subject to change without prior notice.
Principal Funds, Inc. is distributed by Principal Funds Distributor, Inc.
For Public Distribution in the United States. For Institutional, Professional, Qualified and/or Wholesale Investor Use Only in other Permitted Jurisdictions as defined by local laws and regulations.
Principal®, Principal Financial Group®, and Principal and the logomark design are registered trademarks of Principal Financial Services, Inc., a Principal Financial Group company, in the United States and are trademarks and services marks of Principal Financial Services, Inc., in various countries around the world.
Principal Global Investors leads global asset management at Principal.®
2283616