
Introduction
Total loan originations increased 47% year-to-date through 3Q 2025, reaching their fifth-highest level since 1Q 2002. Outstanding mortgage debt rose to nearly $4.9 trillion as of 2Q 2025, up 4.5% year over year. Despite the increase in activity, lending standards remained conservative and did not loosen over the past year. Against this backdrop, the NCREIF/CREFC Open-End Debt Fund Aggregate delivered a 6.1% net
In our 2026 Inside Real Estate Outlook, we reiterated that commercial real estate (CRE) debt remains our top recommendation across all four quadrants (public vs private and equity vs debt). Although increased competition has compressed spreads, we continue to see ample opportunity to originate attractive loans in the year ahead—the Mortgage Bankers Association forecasts total CRE originations to rise +27% in 2026. Risk-adjusted returns remain compelling, supported by conservative loan-to-value ratios on property values that have already reset by roughly 20%.
We also believe the stability of CRE debt funds is underappreciated. As a result, they play an important role in portfolio construction: over the medium to longer term, allocating to CRE debt within a broader mix of private corporate credit or private equity may help to reduce volatility, improve Sharpe ratios, and mitigate drawdown risk. It’s possible that these benefits could become even more compelling in the years to come as CRE debt has already experienced a downturn, whereas private corporate credit and private equity have not.
According to the Mortgage Bankers Association (MBA), total CRE mortgage originations increased +27% in 2025 to $634bn. The positive momentum is expected to continue in the year ahead with originations rising another +27% to $805bn, with core CRE rising +34% and multifamily increasing +21%. Investors often ask why CRE debt markets are gaining momentum even as distress continues to rise. The answer lies in where we are in the cycle and how opportunity is shifting within the market.
Public REIT valuations—often a leading indicator at cyclical turning points—have rebounded meaningfully from their 2023 trough. Private market valuations across major property types have stabilized, and credit markets are once again functioning, supporting renewed transaction activity. Distress, by contrast, is a lagging indicator and continues to rise as the long tail of the downturn works through the system. While elevated delinquencies may weigh on legacy portfolios still absorbing write-downs, they are far less relevant for new funds deploying fresh capital. In this sense, CRE debt has effectively become a “1.0 versus 2.0” market, with new vintages standing to benefit.
A large share of loans coming due are refinancing rather than defaulting. Notably, 73% of CMBS conduit loans originally scheduled to mature in 2025 paid off at or before maturity as of the end of 2025, only modestly below the 78% historical average from 2012 to 2024. With approximately $2.1 trillion of loans maturing over the next three years, refinancing demand should remain a durable source of origination opportunity.
Transaction volumes were 17% higher in the first nine months of 2025 compared with the same period in 2024. Historically, rising volumes have been a reliable signal of improving market confidence, and higher transaction activity directly translates into increased demand for debt capital.
Newly constructed assets often require bridge loans or permanent take-out financing, adding another layer of demand for CRE debt. While construction activity is expected to moderate going forward, the combination of recent deliveries, loan maturities, and improving transaction volumes supports a robust pipeline of opportunities for lenders.
CRE debt funds have been a clear beneficiary of these dynamics, with their share of total lending rising to a record 14% in 1H25, well above the post-2008 average of roughly 9%. We believe the true share is likely even higher once accounting for the portion of CMBS issuance tied to CRE CLOs, which many CRE debt funds use as financing vehicles. CRE CLO issuance reached its second-highest level since the post-GFC period in 2025, totaling more than $30.5 billion. While competition is increasing, we expect CRE debt funds to remain an integral and durable component of the commercial real estate debt markets.
Lending standards became less restrictive in 2025 (i.e., less tight), but they did not loosen. This distinction matters. More conservative loan-to-value ratios on property prices that have already reset by roughly 20% help mitigate the risk of further declines in unlevered property valuations. To put the magnitude in perspective, a further reset of this scale would imply cumulative valuation declines of more than 45% this cycle—well beyond the 30%–35% declines experienced in the early 1990s following the Savings & Loans crisis and during the Global Financial Crisis.
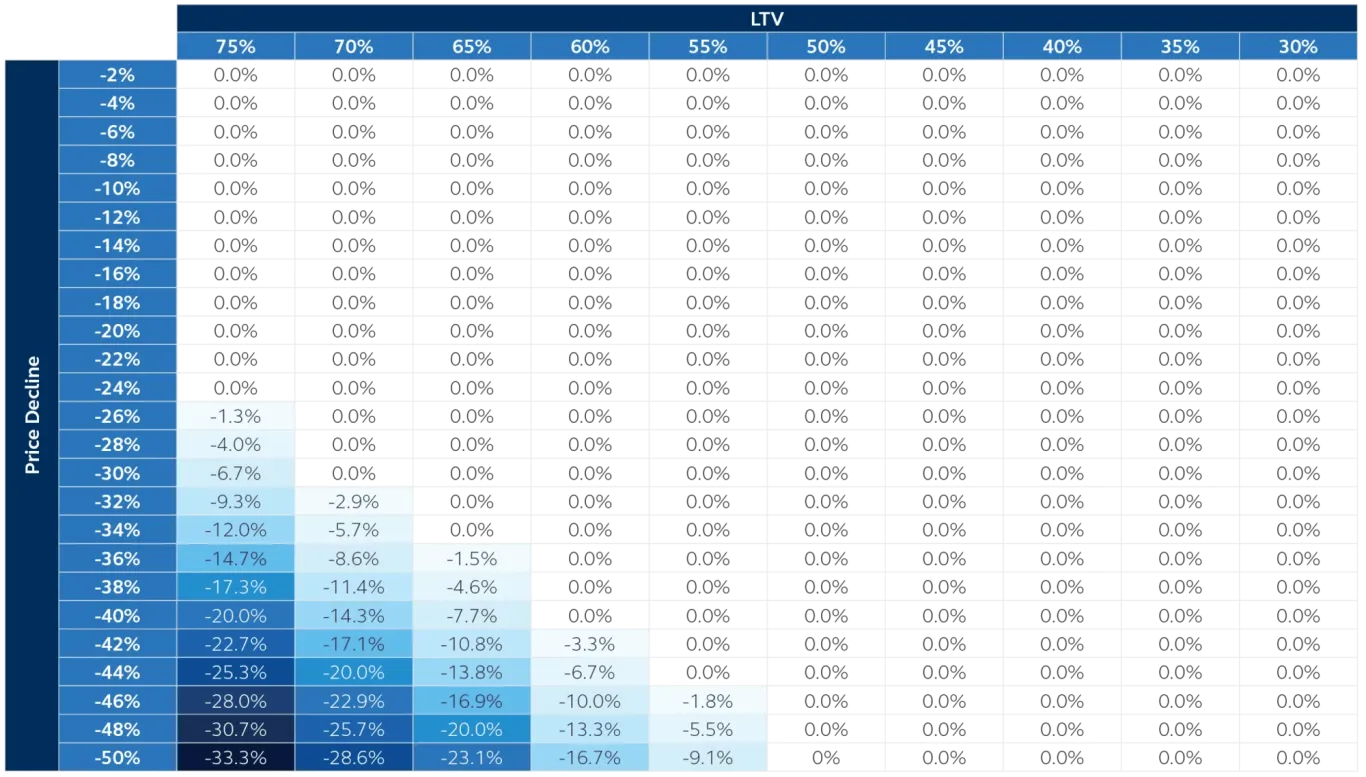
Source: Principal Real Estate, January 2026.
It is also important to remember that CRE mortgages are secured by income-producing real estate—the real estate itself is the collateral, and it does not disappear overnight. In the event of foreclosure, lenders can take ownership of the underlying property at an attractive basis, creating the potential for redevelopment or re-leasing at compelling returns.
We believe this dynamic is a key reason why open-ended CRE debt funds have delivered essentially flat annualized appreciation returns of -0.14% since 2014. The only years with negative returns were -3.1% in 2022, -4.3% in 2023, and -3.9% in 2024, as well as -1.6% in 2020 during COVID). Given our view that the commercial real estate cycle has entered a recovery phase, with prices across major property types having stabilized, we expect appreciation returns for open-ended debt funds to turn positive at some point in 2026.
We believe an even more important consideration is the relative attractiveness of volatility-adjusted returns for CRE debt versus private corporate credit and private equity. The latter two strategies have attracted substantial investor attention over the past decade, largely due to their strong absolute return profiles.
For example, as of 2Q 2025, our analysis of pooled net total returns from Preqin (after management fees and carried interest) shows that North American private equity vehicles (excluding venture capital) have generated 14.6% annualized returns since 1Q 2014, while North American private credit vehicles have delivered 8.7% annualized returns over the same period. By comparison, open-ended CRE debt funds have produced 6.2% annualized total returns, net of fees and promotes, over that same timeframe.
However, CRE debt funds also have much lower volatility than both private corporate credit and private equity over longer periods of time. As a result, we think the portfolio optimization benefits of adding an allocation of CRE debt to either alternative strategy is likely underappreciated. In Exhibit 4, we show modern portfolio statistics (MPTs) at various allocation bands based on a back test of returns since 1Q 2014. In every instance, Sharpe ratios are improved and a drawdown risk is mitigated by adding an allocation of open-ended CRE debt funds to a portfolio of private equity or private credit. While investors do give up some returns, we think it’s outweighed by the benefits.
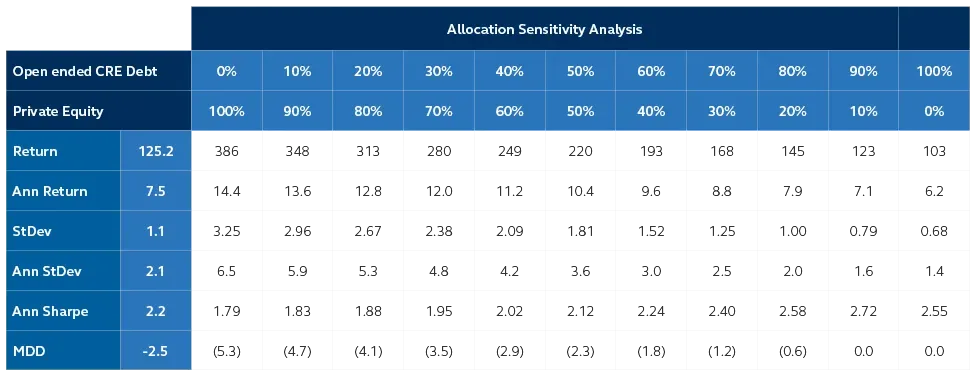

Source: NCREIF/CREFC, Preqin, Principal Real Estate, 3Q 2025. MDD = max drawdown.
Conclusion
Commercial real estate debt delivered strong performance in 2025 and is well-positioned for continued success in 2026 and beyond. With loan originations surging, lending standards remaining conservative, and property valuations having stabilized after meaningful resets, we believe CRE debt offers compelling risk-adjusted returns in today's environment.
The fundamentals supporting CRE debt are on solid footing: a substantial refinancing pipeline, recovering transaction activity, and ongoing financing needs from recent property deliveries should sustain strong origination volumes. Meanwhile, conservative loan-to-value ratios on already-reset property values provide meaningful downside protection—a stark contrast to private corporate credit and private equity markets that have yet to experience a downturn this cycle.
Perhaps most importantly, CRE debt's stability and low volatility make it an effective portfolio diversifier. Our analysis demonstrates that allocating to open-ended CRE debt funds alongside private equity or private credit strategies can improve Sharpe ratios and reduce drawdown risk, even if it means modestly lower absolute returns.
As investors increasingly focus on risk management and portfolio resilience, we believe these benefits position CRE debt as a valuable complement to other private market allocations.
With the commercial real estate cycle having entered recovery and property prices rising again, thereby limiting losses, we maintain our conviction that CRE debt represents one of the most attractive opportunities across both public and private real estate markets today. Indeed, the best vintage returns for CRE debt funds historically occur in the early stages of an early cycle environment.
Footnotes
For Public Distribution in the United States. For Institutional, Professional, Qualified and/or Wholesale Investor Use Only in other Permitted Jurisdictions as defined by local laws and regulations.
Risk Considerations
Investing involves risk, including possible loss of Principal. Past Performance does not guarantee future return. Potential investors should be aware of the risks inherent to owning and investing in real estate, including value fluctuations, capital market pricing volatility, liquidity risks, leverage, credit risk, occupancy risk and legal risk. All these risks can lead to a decline in the value of the real estate, a decline in the income produced by the real estate and declines in the value or total loss in value of securities derived from investments in real estate. Commercial real estate (CRE) investing carries several inherent risks, including those related to the economy, interest rates, market fluctuations, high upfront costs, and tenant-related issues like defaults or high turnover. Economic downturns can lead to decreased property values and increased vacancy rates, while financing costs, insurance expenses, and potential environmental or structural problems can also pose significant challenges. Private debt investments, like alternative investments are not suitable for all investors given they are speculative, subject to substantial risks including the risks associated with limited liquidity, the potential use of leverage, potential short sales, concentrated investments and may involve complex tax structures and investment strategies.
Important information
This material covers general information only and does not take account of any investor’s investment objectives or financial situation and should not be construed as specific investment advice, a recommendation, or be relied on in any way as a guarantee, promise, forecast or prediction of future events regarding an investment or the markets in general. The opinions and predictions expressed are subject to change without prior notice. The information presented has been derived from sources believed to be accurate; however, we do not independently verify or guarantee its accuracy or validity. Any reference to a specific investment or security does not constitute a recommendation to buy, sell, or hold such investment or security, nor an indication that the investment manager or its affiliates has recommended a specific security for any client account.
Subject to any contrary provisions of applicable law, the investment manager and its affiliates, and their officers, directors, employees, agents, disclaim any express or implied warranty of reliability or accuracy and any responsibility arising in any way (including by reason of negligence) for errors or omissions in the information or data provided. All figures shown in this document are in U.S. dollars unless otherwise noted.
This material may contain ‘forward looking’ information that is not purely historical in nature. Such information may include, among other things, projections and forecasts. There is no guarantee that any forecasts made will come to pass. Reliance upon information in this material is at the sole discretion of the reader.
This material is not intended for distribution to or use by any person or entity in any jurisdiction or country where such distribution or use would be contrary to local law or regulation.
This document is issued in:
- The United States by Principal Global Investors, LLC, which is regulated by the U.S. Securities and Exchange Commission.
- Europe by Principal Global Investors (Ireland) Limited, 70 Sir John Rogerson’s Quay, Dublin 2, D02 R296, Ireland. Principal Global Investors (Ireland) Limited is regulated by the Central Bank of Ireland. Clients that do not directly contract with Principal Global Investors (Europe) Limited (“PGIE”) or Principal Global Investors (Ireland) Limited (“PGII”) will not benefit from the protections offered by the rules and regulations of the Financial
- Conduct Authority or the Central Bank of Ireland, including those enacted under MiFID II. Further, where clients do contract with PGIE or PGII, PGIE or PGII may delegate management authority to affiliates that are not authorised and regulated within Europe and in any such case, the client may not benefit from all protections offered by the rules and regulations of the Financial Conduct Authority, or the Central Bank of Ireland. In Europe, this document is directed exclusively at Professional Clients and Eligible Counterparties and should not be relied upon by Retail Clients (all as defined by the MiFID).
- United Kingdom by Principal Global Investors (Europe) Limited, Level 1, 1 Wood Street, London, EC2V 7 JB, registered in England, No. 03819986, which is authorized and regulated by the Financial Conduct Authority (“FCA”).
- This document is marketing material and is issued in Switzerland by Principal Global Investors (Switzerland) GmbH.
- United Arab Emirates by Principal Investor Management (DIFC) Limited, an entity registered in the Dubai International Financial Centre and authorized by the Dubai Financial Services Authority as an Authorised Firm, in its capacity as distributor / promoter of the products and services of Principal Asset Management. This document is delivered on an individual basis to the recipient and should not be passed on or otherwise distributed by the recipient to any other person or organisation.
- Singapore by Principal Global Investors (Singapore) Limited (ACRA Reg. No. 199603735H), which is regulated by the Monetary Authority of Singapore and is directed exclusively at institutional investors as defined by the Securities and Futures Act 2001. This advertisement or publication has not been reviewed by the Monetary Authority of Singapore.
- Australia by Principal Global Investors (Australia) Limited (ABN 45 102 488 068, AFS Licence No. 225385), which is regulated by the Australian Securities and Investments Commission and is only directed at wholesale clients as defined under Corporations Act 2001.
- Hong Kong SAR by Principal Asset Management Company (Asia) Limited, which is regulated by the Securities and Futures Commission. This document has not been reviewed by the Securities and Futures Commission. This document may only be distributed, circulated or issued to persons who are Professional Investors under the Securities and Futures Ordinance and any rules made under that Ordinance or as otherwise permitted by that Ordinance.
- Other APAC Countries/Jurisdictions, this material is issued for institutional investors only (or professional/sophisticated/qualified investors, as such term may apply in local jurisdictions) and is delivered on an individual basis to the recipient and should not be passed on, used by any person or entity in any jurisdiction or country where such distribution or use would be contrary to local law or regulation.
Principal Global Investors, LLC (PGI) is registered with the U.S. Commodity Futures Trading Commission (CFTC) as a commodity trading advisor (CTA), a commodity pool operator (CPO) and is a member of the National Futures Association (NFA). PGI advises qualified eligible persons (QEPs) under CFTC Regulation 4.7.
Principal Funds are distributed by Principal Funds Distributor, Inc.
© 2026 Principal Financial Services, Inc. Principal®, Principal Financial Group®, Principal Asset Management, and Principal and the logomark design are registered trademarks and service marks of Principal Financial Services, Inc., a Principal Financial Group company, in various countries around the world and may be used only with the permission of Principal Financial Services, Inc. Principal Asset Management℠ is a trade name of Principal Global Investors, LLC. Principal Real Estate is a trade name of Principal Real Estate Investors, LLC, an affiliate of Principal Global Investors.

No information