Forward

The global economic landscape faces challenges heading into the second half of 2023. With Europe weakening, China disappointing, and the U.S. approaching recession, markets are becoming more volatile, and seizing the right investment opportunities requires an increasingly active focus.

As we outline in this year’s Midyear perspective, the top of the 2023 investment theme list: The painful spike in inflation last year has meant that many global developed market central banks have been forced to aggressively tighten monetary policy. It is doubtful that any rate cuts will come this year, and the U.S. economy is still to face the lagged effects of policy rate increases to date.

For global investors, the year's second half will likely see equities face pressure from earnings declines. At the same time, riskier fixed income assets have yet to entirely discount the impending economic slowdown. And with the slowing growth outlook likely further depressing select alternatives, such as commodities and natural resources, preparing portfolios for the future will, more than ever, require innovative solutions aligned with client investment goals.

Despite the gloom, the second half of 2023 arrives with plenty of opportunity. For starters, any equity market pullback will likely be brief due to the short and shallow nature of the expected U.S. recession, and the subsequent swift recovery will demand an agile and proactive response from investors. Non-U.S. and and small cap equities may provide opportunities, benefitting from more attractive valuations, a structurally weaker USD and, in the case of Japan, an inflation renaissance.

In this evolving environment, look to high quality fixed income investments for stability and income. And although high quality duration is likely to outperform as the economy slows, as the short and shallow nature of the recession suggests that defaults in the broad credit space should not significantly spike—spreads offer reasonable compensation for the additional risk as investors move down the quality spectrum.

Alternative investments will also play a vital role in diversifying future portfolios beyond traditional equities and fixed income, and listed infrastructure investments can be sought to mitigate ongoing inflation risks.

Every day, the teams at Principal Asset Management leverage deep knowledge and experience to help you, our clients, stay ahead. I am exceedingly proud of the forward-thinking perspectives, insights, and solutions they are developing, and we look forward to working with you to achieve your own investment goals.

As we pass the mid-year mark, we hope the following perspectives empower you with knowledge and insights to make informed investment decisions. We greatly appreciate the trust and confidence you have placed in us, and we are committed to continuing our work together. Thank you for your continued support.

Kamal Bhatia headshot
Kamal Bhatia, CFA
Global Head of Investments
 

A short and shallow recession

Seema Shah headshot
Seema Shah
Chief Global Strategist

Investors typically associate the concept of recession with drastic and prolonged asset price falls. Yet, the U.S. recession, presumably to start early next year, will look and feel very different from recent recessionary episodes. Not only is it likely to be shorter in duration, but it will also be of a much shallower magnitude, and any risk asset declines will be similarly short and shallow. As a result, investors need to think beyond just preparing portfolios for recession; they need to consider how to position for recovery.

The recession outlook

Despite the 525 basis points of U.S. Federal Reserve (Fed) policy tightening since last February, incoming economic activity data remains resilient, consumer demand remains strong, and jobs growth only just started to slow. (The latest BLS jobs print, from July, remains above the 175,000 jobs added level that would typically be considered consistent with solid growth.) The current data paints a picture of economic strength and, as such, many investors remain skeptical of recession forecasts.

However, current strength doesn’t invalidate impending recession. Monetary policy often works with long and variable lags, and given how quickly interest rates have been increased, policy has only been restrictive for a reasonably short period. In fact, real policy rates have only recently moved into positive territory, suggesting that the pressure on economic activity is just getting underway. With the Fed indicating that policy rates will remain elevated for a prolonged period, a sustained monetary policy drag is expected to exacerbate already tightening credit conditions, undermining the health of the U.S. economy.

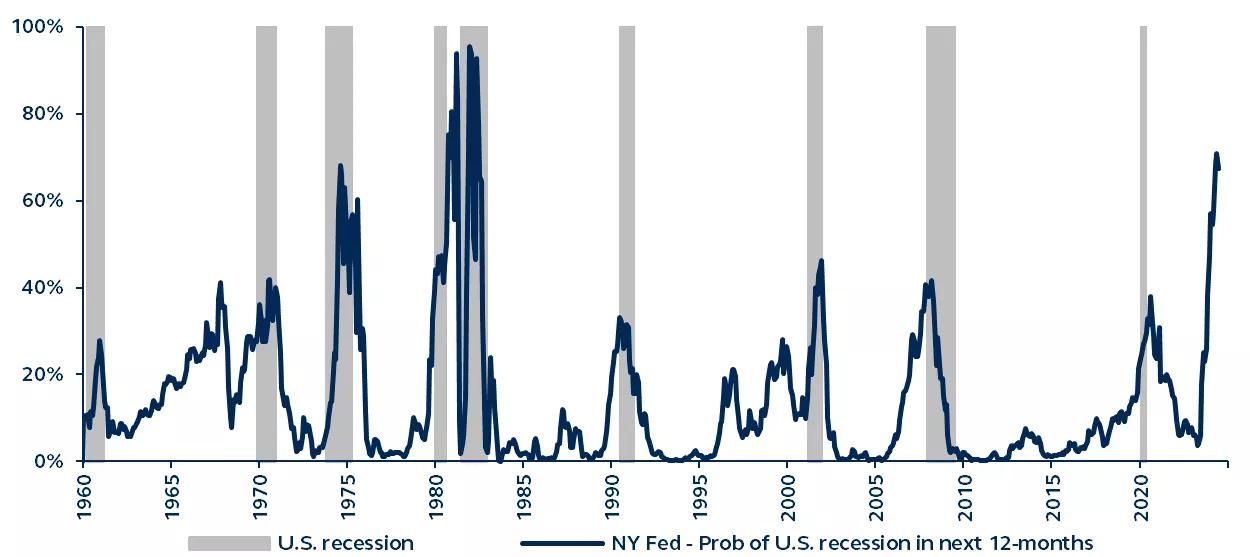
U.S. recession probability in next 12 months
Federal Reserve Bank of NY, 1960–present

Line graph showing U.S. recession probability in the next 12 months

Source: Federal Reserve Bank of New York, Bloomberg, Principal Asset Management.
Data as of June 30, 2023.

Indeed, even as the U.S. economy looks robust today, most leading indicators are picking up on the looming impact of Fed hikes and emphatically signal recession:

  • The New York Fed’s own recession model suggests that the probability of recession within the next 12 months is the highest since the early 1980s.
  • The U.S. Treasury yield curve remains deeply inverted — a historically reliable recession indicator.
  • In addition to the 2s10s curve inversion being both material and sustained, other yield curve segments are also inverted, including the 3-month 1-year curve, which is typically consistent with recession risk within 12 months.
  • The Global Insights team’s forecasts are for the U.S. economy to fall into recession in 2Q 2024.
U.S. recessions through time

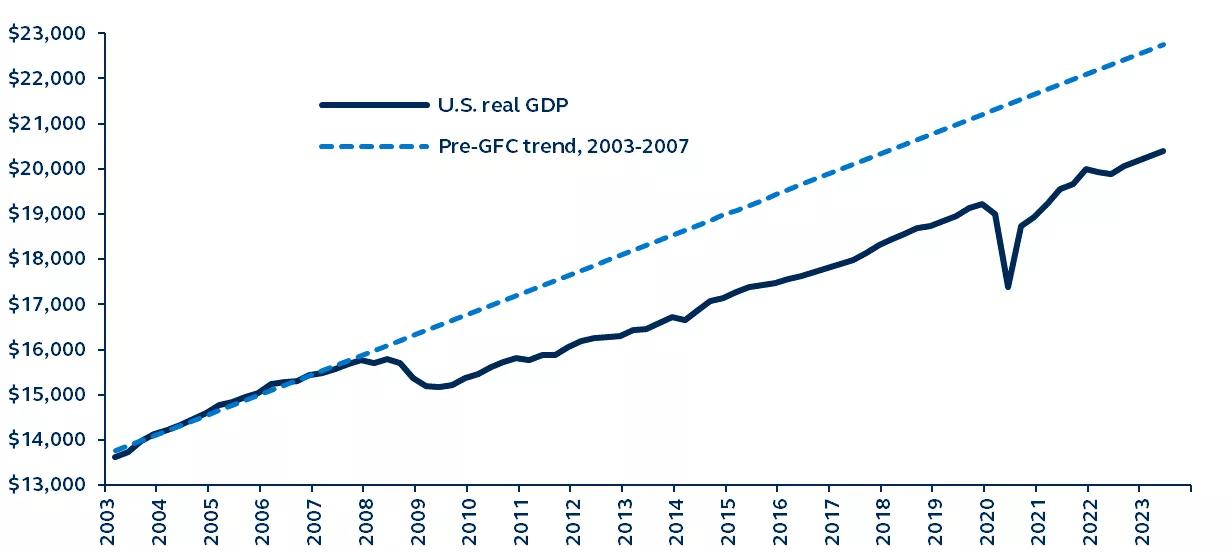
Since the Great Depression of the early 1930s, there have been 14 U.S. recessions. On average, recessions have lasted 14 months and resulted in a 2.5% drop in economic output. Some recent recessions have been very severe: the 2008 Great Recession lasted 18 months and resulted in a 4.3% GDP decline, while the unemployment rate more than doubled to 10 percent. That recession damaged the U.S. economy so significantly that it did not regain its pre-recession GDP level until 3Q 2012, and output still remains below its pre-2008 trend. In other words, to this day, the U.S. economy has not fully recovered from the Great Recession.

U.S. real GDP versus pre-GFC trend
Trillions of chained 2012 dollars, seasonally adjusted, 2003–present

Line graph

Source: Bureau of Economic Analysis, Bloomberg, Principal Asset Management. Data as of June 30, 2023.

Not surprisingly, financial markets reacted very adversely to the Global Financial Crisis (GFC). The S&P 500 index fell 56.8% from October 2007 to March 2009, and it took four years to recover its losses fully. Similarly, during the dot-com crash in the early 2000s, the S&P 500 also dropped almost half its value and then took seven years to recover.

Will the looming recession and the financial market impact be as severe? The Federal Reserve has raised policy rates by 525 basis points in under 18 months, a comparable move to that seen in the run-up to the GFC. However, not every recession has to be a protracted economic disaster like the Global Financial Crisis, even if monetary tightening has been equally significant. The effectiveness of monetary policy and its impact on growth depends on the economy's interest rate sensitivity.

The 2008 recession (and, similarly, the 2001 dot-com bust) was particularly deep because of the significant debt-related excesses that had built up in specific segments of the economy, elevating the U.S. economy’s interest rate sensitivity. It took the economy several years to unwind and recover from those imbalances, resulting in multiple years of weak private sector activity, despite low interest rates.

Today, the U.S. economy’s interest rate sensitivity is much lower. Indeed, the unique starting conditions created by the post-pandemic environment mean that today's economy looks very different from the start of the dot-com bust and the Great Recession.

Lower interest rate sensitivity

Unlike the start of the 2008 recession, households and businesses today are not so extended. Lockdowns during 2020 and 2021 generated forced savings while government and central bank supports provided companies with access to credit and boosted household income. As a result, U.S. businesses and households have entered this slowdown with reduced leverage and elevated excess savings, promoting resiliency in the face of significant shocks.

Corporates

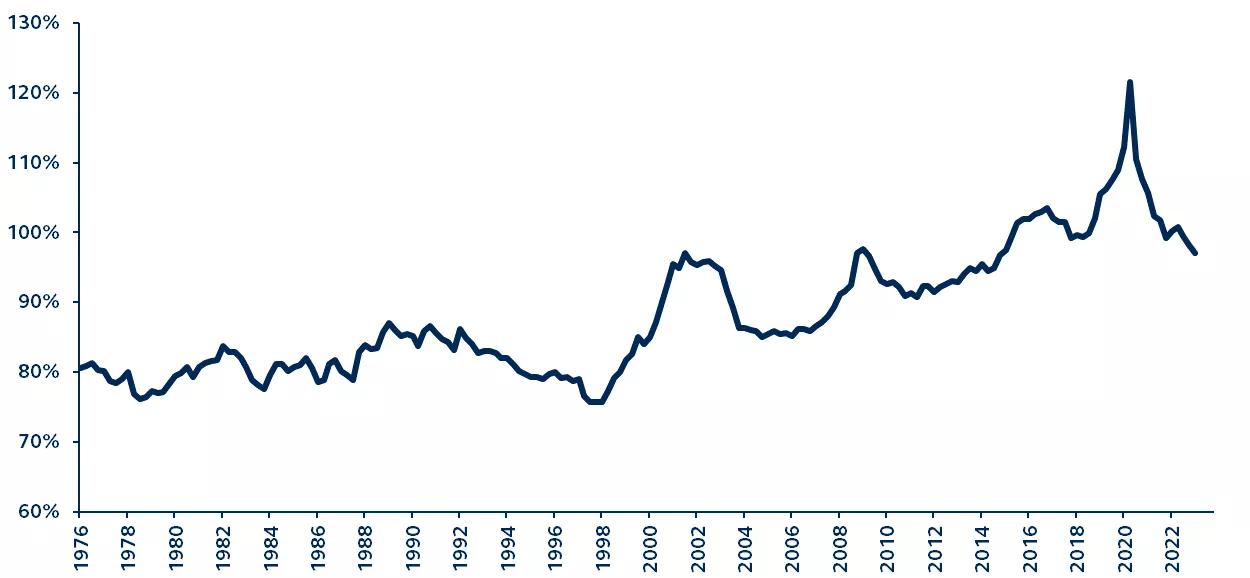
U.S. corporate debt to GDP
Total non-financial corporate debt as percent of GDP, 2003–present

Line graph of U.S. real GDP vs. pre-GFC trend from 2003-2023

Source: Bureau of Economic Analysis, Bloomberg, Principal Asset Management. Data as of June 30, 2023.

At around 100% of GDP, corporate debt is historically elevated and slightly higher than at the onset of the 2008 recession. However, looking at debt levels in isolation does not necessarily paint an accurate picture of financial risk. A record corporate debt binge during 2020 and 2021, in response to the Fed’s emergency corporate debt buying facilities, allowed companies to raise significant liquidity, shoring up their balance sheets and locking in record low interest rates. As a result, around 40% of today’s outstanding investment grade and high-yield corporate debt was raised during that time frame, enabling corporates to reduce leverage and for their interest burden to be at the lowest levels seen in over 50 years.

A substantial amount of corporate bonds outstanding could potentially pose a financial stability risk. If a large number of firms have to refinance their debt during a period of rising and elevated interest rates, the increased cost of servicing that debt can significantly increase the risk of corporate default spikes and, therefore, deep recession. However, over the next couple of years, rollover risk is limited. Just 7% of investment grade and 4% of high yield bonds mature in 2024, and an additional 10% and 11%, respectively, in 2025, by which time policy rates should be on their way to normalization.

Typically, in a recession, credit issues accelerate and exacerbate the slowdown. In the current situation, the health of corporate sector borrowing dynamics should prevent a sharp surge in defaults, muting the potential credit drag impact.

Households

Unlike in 2008, today’s household balance sheets are in fairly good shape. Household debt as a percentage of income, the debt service ratio, and delinquencies are meaningfully lower than at the start of the Great Recession, although they have risen since mid-2021. How have balance sheets remained healthy against sharply rising interest rates?

  1. The majority of U.S. mortgages are at fixed rates, with many homeowners having taken advantage of the collapse in long-term interest rates in the aftermath of the pandemic to lock in low mortgage rates. As a result, the household sector has been less vulnerable to rising mortgage rates.
  2. During the pandemic and subsequent lockdowns, an eviction moratorium, and federal and private forbearance policies on many types of debt left households better off, in part by allowing many households to forego interest payments.
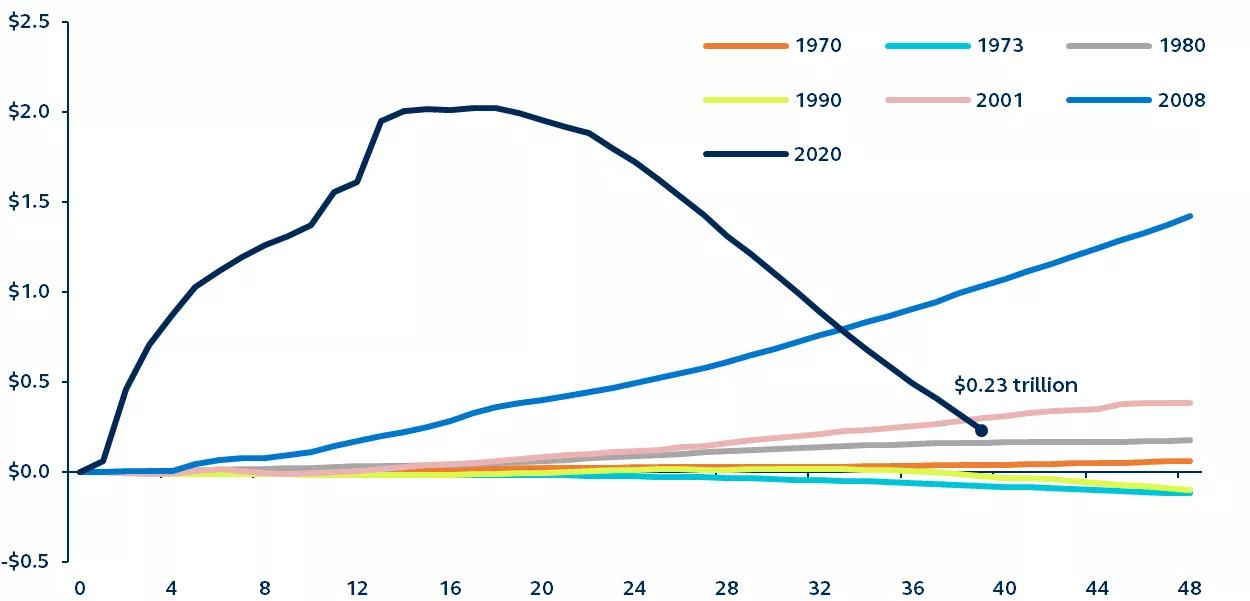
  3. Generous pandemic-related fiscal support injections, and reduced spending opportunities during the lockdowns contributed to a significant build-up of excess savings. By the start of 2021, the stock of excess savings had increased to around $2 trillion. As the economy re- opened, households dipped into this war-chest of savings to fund their purchases (reducing the need for credit card spending) as well as to pay down their debts.

Aggregate excess savings following recession
Trillions, months since start of recession

Line graph

Source: Bloomberg, Principal Asset Management. Data as of June 30, 2023.

The difference between the post-pandemic period and post-2008 period (as well as other recessions) is stark. After the Great Recession, households were considerably more cautious with their spending, gradually building up their savings as they tried to repair their balance sheets. By contrast, in the current cycle, the significant increase in excess savings has both fuelled consumer spending and helped prevent a build-up in household indebtedness.

Looking forward

The uniqueness of the post-pandemic fiscal support has likely lengthened the “long and variable” lags of monetary policy, shielding the economy from higher policy rates through the past 18 months. For the corporate sector, with the corporate debt maturity wall still low for the next two years and thereby continuing to insulate many companies from higher interest rates, the lags of monetary policy are particularly extended. By contrast, however, the various support structures for households are now starting to expire. Pandemic-related fiscal support is ending, while much of the excess savings cushion has also now been exhausted, with only an estimated $0.23 trillion left. By early 2024, many households will be exposed to the full burden of higher interest rates.

Consumer spending will likely start to weaken over the coming quarters. Yet the impact on economic activity will be partially offset by still-strong corporate spending, limiting the forecasted downturn to a short and shallow recession, extending two quarters, resulting in just a 0.4% drop in economic output, and only pushing the unemployment rate up to around 4%. For investors, this will likely be the environment of a soft recession.

Investor perspectives

Preparing portfolios for changing economic conditions, even periods of economic expansion, can be challenging. When the upcoming environment follows a “soft recession” that is brought about by fairly unique circumstances, it is researched, insightful, differentiated perspectives that can help set stage for some important rebalancing opportunities across the fixed income, equities and real estate investment spectrum, while also implying important benefits from diversification.

In Midyear perspectives, we asked senior investment leaders from across Principal Asset Management where they expected to find opportunities in the second half of 2023, and to highlight the investment themes that would be driving markets heading into 2024.

Multi-Asset:

Todd Jablonski headshot
Todd Jablonski, CFA
Global Head of Multi-Asset Investing

Real Estate:

Todd Everett headshot
Todd Everett
Global Head of Private Markets
 

Equities

Much of the equity market recovery from the October 2022 lows has been attributable to optimism about a “pivot” to a more dovish monetary policy. Despite financial markets anticipating the Fed’s latest policy hike was its last in the cycle, the central bank’s rhetoric remains cautionary and signals that rate cuts are unlikely this year. This has been further reinforced by even more aggressive hikes in the United Kingdom, a resumption of tightening in Canada, and the European Central Bank’s 425bps of rate hikes over the past 12 months.

Notably, the headline double-digit returns for the S&P 500 year-to-date mask much more anemic market conditions under the surface. This environment warrants a degree of caution among equity investors in the near term but also has created numerous and intriguing relative value and rebalancing opportunities across the capitalization spectrum, sectors, and regions.

Market breadth in the U.S. is strikingly narrow

Indeed, fewer than 10 of the most prominent mega-cap stocks have accounted for nearly all the index’s advance year to date—all driven by the common theme of their involvement (or aspirations) in artificial intelligence. Conversely, nearly all other sectors have delivered low single-digit returns at best. Interest rate sensitive sectors—financials, real estate, utilities—remain in negative territory, as one might expect amid tight credit conditions.

Most stocks remain in bear market territory, especially among small- and mid-caps

Many of these companies have already priced in a high degree of recession risk and have adjusted to tighter credit conditions, and therefore, seemingly offer compelling relative valuation and recovery opportunities. They are likely less susceptible to future cyclical volatility or further rate hikes, especially compared to the handful of long-duration growth mega-caps that have dominated.

Reshoring is altering the international landscape

The much-anticipated China reopening has disappointed to the downside, and local institutions have been “encouraged” to favor buying stocks of State-Owned Enterprises (SOEs) over private enterprises, another discouraging sign for foreign investors. Meanwhile, some “green shoots” and a broadening of opportunities in Europe, Latin America, and South-East Asia are appearing. Japan warrants special mention for its significant recent progress in improving governance and capital allocation across a growing number of companies.


Fixed Income

With moderating inflation and slowing economic data, central bank policy on balance should start to shift away from aggressive action toward a period of measured observation. This shift in posture will likely afford time for a slowdown in underlying growth to be better reflected in the economic data, while continuing to challenge policymakers as they attempt to reign in inflationary pressures while avoiding a recession. With several historically reliable economic indicators suggesting that a recession is increasingly probable over the next few quarters, our base case continues to reflect a view that any economic contraction will be short and shallow.

This outlook sets the stage for fixed income to deliver attractive results for investors across a range of asset classes, particularly high-quality sectors, which tend to deliver the most consistent returns on a risk-adjusted basis in the early stages of a recessionary period.

Mortgage-Backed Securities (“MBS”)

Recent technical pressure in the sector represents an opportunity for investors over the longer run. Agency MBS enjoy a government guarantee of credit risk, which should bode well if the economy slows into a recession in the coming quarters. Fundamentals remain strong with no refinancing risk based upon current rate levels and high implied interest rate volatility, which will be a tailwind for the sector thanks to reduced option costs if it normalizes.


Multi-asset

Multi-asset investors understandably entered 2023 with a fair dose of pessimism. Over the past five decades, 60/40 portfolios had delivered 9.4% annual returns, marginally below the S&P 500’s 10.9% return—but with much lower volatilities, part of the reason multi-asset strategies had become so attractive for investors with a limited risk budget. 2022, unfortunately, saw both stocks and bonds deliver negative total returns as well as the largest annual loss for the 60/40 portfolio since 1973.

2022’s abysmal performance raised a chorus of calls for “the death of the 60/40 portfolio,” with investors concerned that multi-asset portfolios’ risk efficiency benefits may be fundamentally reduced. However, before concluding that the 60/40 is dead, it is important to understand the drivers of stock-bond correlation and whether the 2022 rise was, perhaps, just a temporal event.

Receding inflation and the likely end to the Fed’s hiking cycle suggest the macro environment will likely put downward pressure on stock-bond correlations as growth takes the driver’s seat. Indeed, the uncertainty around the growth outlook presents a challenging environment for investors, with market expectations jumping between hard-landing and soft-landing scenarios in 2023. Our forecast for a short, shallow recession further implies benefits from diversification.

Accordingly, stock-bond correlations have started to fall. 2023’s correlation decline adds to the argument that 2021-2022 was an anomaly rather than a permanent shift in regime. Lower correlations and higher bond yields make multi-asset portfolios attractive again for investors seeking risk-adjusted returns.

Our multi-asset strategies today argue for a cross-asset neutral stance. A short and shallow recession implies that the window for increasing exposure to equities at attractive valuations will be small and investors should avoid the pitfalls of attempting to time market troughs. Bonds will provide important stability during the coming economic slowdown, and we keep our overweight exposure to U.S. Treasurys, mortgages, and investment grade credit, recognizing that the environment is ripe for outperformance by longer-duration, high-quality assets.


Real Estate

Commercial real estate is currently in the eye of a central-bank induced storm, with higher interest rates exerting downward pressure on values. We expect relief and stabilization once the U.S. Federal Reserve rate tightening cycle ends, but real estate values will stay pressured until signs of a pivot emerge. Until then, investors should remember that past cycles have shown that short-term declines in real estate valuations offer compelling long-term opportunities. Whether it was the savings & loan recession, the dot-com bust, or the global financial crisis, private equity real estate performance post-trough was highly compelling, achieving double-digit returns in the five years that followed.

Investors should be preparing to take advantage of the 2024 and 2025 vintages in real estate, however, with interest rates not expected to retreat to the lows in the last cycle, strategy and property selection will be crucial to performance. For property type selection, we believe landlord pricing power should be most pronounced in the structurally resilient property types and market locations where secular trends in demographics, infrastructure, and advances in technology and innovation drive tenant demand.

Our longer-term outlook strongly favors investment strategies in the structurally driven property types of industrial, self-storage, residential, data centers, life science/medical office, and necessity retail. Investors seeking immediate exposure to real estate or to ongoing dislocation could consider debt capital opportunities—private and public—where spreads, coupons, and credit offer core to core-plus potential returns with the benefit of subordinated equity risk.

Real Estate Investment Trusts (“REITs”)

Public REITs provide an interesting opportunity relative to private real estate markets and public equities over the next one to three years. As is typically the case, public REIT markets lead private real estate, and since the start of the Fed rate hiking cycle, REITs have led on the way down. Investors should expect that they will also lead on the way up, and over the past three quarters, this trend has started.

Although investor concern about commercial office properties is warranted, office REITs make up a small portion of the overall public real estate universe. The asset class's low-levered, defensive balance sheets and a mixture of property types should be supportive in a macro environment of tighter credit conditions and slowing growth.1

With historically cheap relative valuations to both equities and private real estate providing an attractive entry point, public REIT markets are poised for future outperformance. Historically, REITs have started a new return cycle of strong absolute and relative returns versus stocks late in a rate hiking cycle and after long-term real yields have peaked. While tighter lending conditions and negative sentiment towards real estate remain a headwind, investors should watch for signs of peaking rates and green shoots of improving real estate capital markets as catalysts for public REIT outperformance relative to equities.

Listed Infrastructure

While the asset class has significantly underperformed broader global equities to start the year, investors now face an attractive entry point into listed infrastructure given cheaper relative valuations. Though both asset types may still see negative absolute returns as the economy weakens, infrastructure stocks should benefit from more resilient fundamentals, as infrastructure businesses deliver essential services, where demand is relatively insensitive to economic cycles. Contractual and regulatory protections enable infrastructure companies to operate from positions of financial strength in various macroeconomic environments. While higher interest rates are having a modest impact on earnings, listed infrastructure companies generally employ longer-dated debt than other businesses.

The recent underperformance of listed infrastructure relative to unlisted strategies has little to do with a divergence in fundamentals and instead reflects a temporary dislocation caused by key differences in how the respective markets operate. There is now a case for listed infrastructure to outperform over the medium-term as unlisted values fall and/or as listed performance begins to recover.

Longer-term, we continue to expect the structural growth drivers for listed infrastructure companies, such as decarbonization and technological innovation, to remain tailwinds that outlast today's macro concerns.

1 REITs are primarily comprised of structurally driven property types: industrial, senior housing, single-family rental, etc.) and only 3% U.S. traditional office.

Macro views
Asset allocation
Equities
Fixed income
Listed Infrastructure
Real estate
Disclosure

Risk considerations
Investing involves risk, including possible loss of principal. Past Performance does not guarantee future return. All financial investments involve an element of risk. Therefore, the value of the investment and the income from it will vary and the initial investment amount cannot be guaranteed. Asset allocation and diversification do not ensure a profit or protect against a loss. Inflation and other economic cycles and conditions are difficult to predict and there Is no guarantee that any inflation mitigation/protection strategy will be successful. Equity investment options involve greater risk, including heightened volatility, than fixed-income investment options. Fixed-income investment options are subject to interest rate risk, and their value will decline as interest rates rise. Real estate investment options are subject to risks associated with credit, liquidity, interest rate fluctuation, adverse general and local economic conditions, and decreases in real estate values and occupancy rates.

Important Information
This material covers general information only and does not take account of any investor’s investment objectives or financial situation and should not be construed as specific investment advice, a recommendation, or be relied on in any way as a guarantee, promise, forecast or prediction of future events regarding an investment or the markets in general. The opinions and predictions expressed are subject to change without prior notice. The information presented has been derived from sources believed to be accurate; however, we do not independently verify or guarantee its accuracy or validity. Any reference to a specific investment or security does not constitute a recommendation to buy, sell, or hold such investment or security, nor an indication that the investment manager or its affiliates has recommended a specific security for any client account. Subject to any contrary provisions of applicable law, the investment manager and its affiliates, and their officers, directors, employees, agents, disclaim any express or implied warranty of reliability or accuracy and any responsibility arising in any way (including by reason of negligence) for errors or omissions in the information or data provided. This material may contain ‘forward-looking’ information that is not purely historical in nature and may include, among other things, projections and forecasts. There is no guarantee that any forecasts made will come to pass. Reliance upon information in this material is at the sole discretion of the reader.

This material is not intended for distribution to or use by any person or entity in any jurisdiction or country where such distribution or use would be contrary to local law or regulation.

This document is intended for use in:

  • The United States by Principal Global Investors, LLC, which is regulated by the U.S. Securities and Exchange Commission.
  • Europe by Principal Global Investors (Ireland) Limited, 70 Sir John Rogerson’s Quay, Dublin 2, D02 R296, Ireland. Principal Global Investors (Ireland) Limited is regulated by the Central Bank of Ireland. Clients that do not directly contract with Principal Global Investors (Europe) Limited ("PGIE") or Principal Global Investors (Ireland) Limited (“PGII”) will not benefit from the protections offered by the rules and regulations of the Financial Conduct Authority or the Central Bank of Ireland, including those enacted under MiFID II. Further, where clients do contract with PGIE or PGII, PGIE or PGII may delegate management authority to affiliates that are not authorised and regulated within Europe and in any such case, the client may not benefit from all protections offered by the rules and regulations of the Financial Conduct Authority, or the Central Bank of Ireland. In Europe, this document is directed exclusively at Professional Clients and Eligible Counterparties and should not be relied upon by Retail Clients (all as defined by the MiFID).
  • United Kingdom by Principal Global Investors (Europe) Limited, Level 1, 1 Wood Street, London, EC2V 7 JB, registered in England, No. 03819986, which is authorized and regulated by the Financial Conduct Authority ("FCA").
  • United Arab Emirates by Principal Global Investors LLC, a branch registered in the Dubai International Financial Centre and authorized by theDubai Financial Services Authority as a representative office and is delivered on an individual basis to the recipient and should not be passed on or otherwise distributed by the recipient to any other person or organization.
  • Singapore by Principal Global Investors (Singapore)Limited (ACRA Reg. No. 199603735H), which is regulated by the Monetary Authority ofSingapore and is directed exclusively at institutional investors as defined by the Securities and Futures Act 2001. This advertisement or publication has not been reviewed by the Monetary Authority of Singapore.
  • Australia by Principal Global Investors (Australia) Limited (ABN 45 102 488 068, AFS Licence No. 225385), which is regulated by the Australian Securities and Investments Commission and is only directed at wholesale clients as defined under Corporations Act 2001.
  • This document is marketing material and is issued in Switzerland by Principal Global Investors (Switzerland) GmbH.
  • Hong Kong SAR (China) by Principal Asset Management Company (Asia) Limited, which is regulated by the Securities and Futures Commission. This document has not been reviewed by the Securities and Futures Commission.
  • Other APAC Countries/Jurisdictions, this material is issued for institutional investors only (or professional/sophisticated/qualified investors, as such term may apply in local jurisdictions) and is delivered on an individual basis to the recipient and should not be passed on, used by any person or entity in any jurisdiction or country where such distribution or use would be contrary to local law or regulation.
  • Nothing in this document is, and shall not be considered as, an offer of financial products or services in Brazil. This presentation has been prepared for informational purposes only and is intended only for the designated recipients hereof. Principal Global Investors is not a Brazilian financial institution and is not licensed to and does not operate as a financial institution in Brazil.

Insurance products and plan administrative services provided through Principal Life Insurance Co. Principal Funds, Inc. is distributed by PrincipalFunds Distributor, Inc. Securities are offered through Principal Securities, Inc., 800 547-7754, Member SIPC and/or independent broker/dealers. Principal Life, Principal Funds Distributor, Inc., and Principal Securities are members of the Principal Financial Group®, Des Moines, IA50392.

© 2023, Principal Financial Services, Inc. Principal Asset ManagementSM is a trade name of Principal Global Investors, LLC. Principal®, Principal Financial Group®, Principal Asset Management, and Principal and the logomark design are registered trademarks and service marks of Principal Financial Services, Inc., a Principal Financial Group company, in various countries around the world and may be used only with the permission of Principal Financial Services, Inc.

3040211

About the author