Against all odds
Our quarterly investment outlook highlights the themes and investment implications for the period ahead.
Global economic strength has withstood U.S. trade policy shocks
Growth forecasts have recovered since Liberation Day and have even improved for 2026. Yet, elevated inflation and U.S. dollar weakness are the lingering scars of the trade policy shocks, adding to already rising global fiscal concerns.
U.S. recession fears have been dismissed, helped along by strong consumers and AI capex spend
Broad macro data have been resilient, supported by robust household and corporate balance sheets. Weakness in labor demand likely stems not from economic distress, but from structural shifts that reduce the need for job growth.
The Federal Reserve does not need to cut policy rates below neutral yet
Resilient U.S. growth and persistent inflation pressures are likely to prevent the Fed from easing policy aggressively, while the OBBBA and recent deregulatory measures point to mildly stimulative fiscal policy in 2026.
Equity markets still have further upside, supported by policy and AI-driven capex
The Fed’s non-recessionary rate-cutting cycle underpins a constructive outlook for 2026 U.S. earnings and equity performance. U.S. small-caps and segments of global markets offer compelling valuations and solid fundamentals.
Fixed income credit: Tight spreads but benefiting from robust macro tailwinds
Credit spreads are at multi-year tights, but a supportive macro backdrop suggests limited default risk and continued strength in higher-yielding fixed income solutions.
Focus on balance and diversification
The outlook for risk assets remains constructive, but stretched valuations underscore the need for balance and diversification. Opportunities may be found among second-order beneficiaries of major investment themes, attractively valued global markets, and selective private market exposures.
Near-term defiance, long-term vulnerability
Key takeaway
Despite policy upheaval, a constructive global outlook has been re-established. However, fiscal fears are becoming more pertinent, potentially weighing on longer-term growth.
Despite notable policy and geopolitical shocks this year, the global economy has proven resilient. Policy volatility has eased, uncertainty has receded, and AI-driven capex has accelerated—supporting a more constructive outlook.
Consensus GDP forecasts for 2025 have been revised higher across the U.S., Euro area, and China, reversing the downgrades seen around “Liberation Day.” U.S. projections for 2026 have also been revised upward, likely reflecting anticipated Fed rate cuts and the impact of the One Big Beautiful Bill Act. In contrast, European 2026 forecasts have edged lower, weighed down by the delayed effects of U.S. tariff, while China’s outlook remains broadly stable.
Still, early-2025 policy disruptions have left lasting marks. Tariffs are reshaping global trade dynamics, likely keeping inflation elevated and persistent. Meanwhile, lingering concerns around U.S. institutional stability and its geopolitical posture may have structurally weakened the U.S. dollar. These pressures are compounded by already rising global fiscal concerns, which threaten to keep long-term government borrowing costs elevated, limiting the scope for future fiscal stimulus, and potentially undermining the effectiveness of monetary policy. The near-term picture is robust, but underlying vulnerabilities are forming.
U.S. economy dismisses post-Liberation Day fears
Key takeaway
Apart from the labor market, broad U.S. economic data has been resilient. Stimulative policy could revive broader economic indicators.
Despite dire post-Liberation Day fears, the U.S. economy has proven broadly resilient. Robust consumer spending and capital expenditures have been key drivers of economic activity data, with AI-related investment emerging as a key growth engine. Technology investment alone is estimated to have contributed roughly one-third of real GDP growth in the first half of the year.
Sentiment across both households and small businesses has also picked up since April, likely reflecting growing optimism around the policy stimulus, as well as greater tariff certainty.
Yet not all measures of economic activity have improved. Labor market data, including non-farm payrolls, have underwhelmed as companies remain cautious on hiring amid policy uncertainty. Still, broad U.S. economic data confirms a gentle moderating trend. The trajectory ahead likely hinges on a few key developments:
- Fed rate cuts succeed in supporting economic activity as the Fed’s careful policy approach avoids missteps.
- OBBBA drives higher capex and expanded hiring plans.
Ultimately, monetary and fiscal policy tailwinds could enhance an already constructive 2026 outlook.
Federal Reserve: Insurance cuts, not recession cuts
Key takeaway
Continued economic resilience indicates that the Fed is unlikely to take policy rates meaningfully below neutral—provided politics don’t get in the way.
In resuming its rate-cutting cycle, the Fed is responding primarily to signs of weakening labor demand. The apparent softening in the jobs market appears to have prompted a pre-emptive move to prevent further deterioration, with September’s rate reduction likely marking the start of a sequence of cuts.
Still, the broader backdrop of economic resilience—underpinned by steady consumer spending, robust capex, and support from the OBBBA—suggests rates are unlikely to fall meaningfully below neutral. Moreover, the potential for tariffs to fuel persistent inflation, alongside shifts in labor supply and concerns about data reliability, suggests a cautious and gradual easing path.
We expect a total of three 25bps cuts this year, followed by further easing in 2026. Overall, this should be a gentle cycle, offering enough stimulus to stabilize the labor market and support more vulnerable sectors.
It’s worth noting that Jerome Powell’s term as Fed Chair ends in May 2026. Given President Trump’s preference for a more dovish FOMC, rate decisions for 2026 may lean dovish—regardless of whether the macro backdrop warrants it.
U.S. equities: Boosted by policy support and AI capex
Key takeaway
Despite lingering risks, the combination of policy support and a non-recessionary rate-cutting cycle points to a constructive outlook for 2026 earnings and equity performance.
U.S. equity markets continued their upward momentum through the third quarter, buoyed by expectations of multiple Fed rate cuts and a surge in AI-related capex. While tech remained central to the rally, more cyclical areas of the market, particularly small-caps, also began to recover after a prolonged period of underperformance. Global equities joined in the strength, with Asia and emerging markets delivering exceptionally robust returns.
Given earlier concerns about elevated tariffs, the rally’s resilience has surprised many. Yet, the combination of a deregulatory policy agenda, enhanced tax incentives, and sustained AI investment suggests a strong earnings outlook for 2026. Historically, equity markets have performed well in the two years following the start of a non-recessionary Fed easing cycle. With recession risks currently low, policy remains a tailwind.
Risks, however, persist. A sharper-than-expected deterioration in the labor market or renewed fiscal stress could push bond yields higher and offset the benefits of easier policy. While an AI spending slowdown would undoubtedly disrupt risk assets, the broader investment theme appears durable, making any volatility in near-term AI capex unlikely to derail its long-term trajectory.
Corporate credit: Riding the robust macro tailwinds
Key takeaway
Robust corporate fundamentals and pro-growth policies support a constructive credit outlook, though tight spreads put focus on relative value and income opportunities.
Strong corporate fundamentals, combined with the emergence of pro-growth policies, are helping to maintain a constructive corporate credit environment. In fact, the rebound in economic sentiment has helped corporate spreads compress further since the start of 3Q, signaling a mostly risk-on tone for credit.
Yet, with valuations at historic tights and additional spread compression potentially limited, this puts additional emphasis on relative value opportunities within credit segments for investors. Additionally, with Treasury yields still elevated, this suggests that income returns remain very attractive, while incremental Fed easing, which weighs on Treasury yields, could benefit total returns.
- Solid corporate balance sheets and fundamentals create a favorable outlook for investment grade credit.
- Still-healthy leverage levels and interest coverage ratios suggest defaults are unlikely to meaningfully increase, keeping high yield value compelling.
- Local currency EM debt should benefit from a weaker dollar and rate cuts, although the strong performance year-to-date suggests selectivity is key.
Embracing the broader global opportunity set
Key takeaway
Despite stretched valuations, resilient growth, AI investment, and policy support keep the outlook for diversified risk assets constructive.
Risk assets have delivered strong returns year-to-date, driven by resilient growth, AI enthusiasm, and expectations of global monetary easing. While equities have surged and credit spreads remain tight, stretched valuations underscore the importance of balance and diversification.
In the U.S., although the scale of AI-related capital expenditure warrants some caution, the theme remains a key market driver. Second-order beneficiaries, including utilities and semiconductors, still offer compelling opportunities. Small-caps are trading at historically attractive valuations and offer discounted entry points and greater sensitivity to domestic growth, reshoring, and innovation trends.
International equities can provide diversification, especially in Europe and emerging markets, where valuations are more attractive and structural drivers like AI adoption, digitalization, and consumer growth remain supportive.
Core fixed income is becoming increasingly relevant, with higher yields offering both income and downside mitigation.
Real estate remains a valuable diversifier, with public REITs trading below asset values and private real estate delivering stable cash flows and inflation mitigation—particularly in sectors like logistics, healthcare, and data infrastructure.
Asset class performance
Total return, annual averages over period shown, 2010-2025 YTD
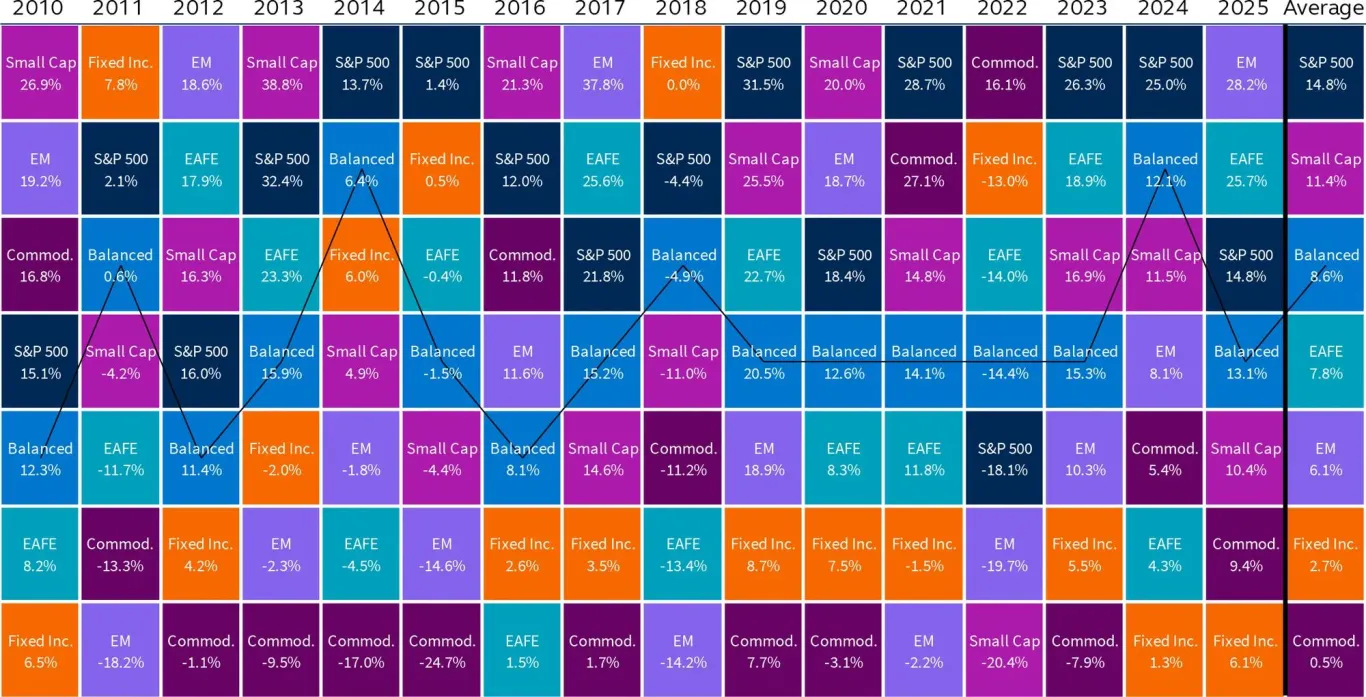
Source: Clearnomics, LSEG, Bloomberg. Asset classes are represented by the S&P 500, MSCI EM, MSCI EAFE, Russell 2000, iShares Core U.S. Bond Aggregate and Bloomberg Commodity Index. The Balanced Portfolio is a hypothetical 60/40 portfolio consisting of 40% U.S. Large Cap, 5% Small Cap, 10% International Developed Equities, 5% Emerging Market Equities, 35% U.S. Bonds, and 5% Commodities. Data as of September 30, 2025.
Principal Global Insights team
Seema Shah
Chief Global Strategist
Brian Skocypec, CIMA
Director, Global Insights & Content Strategy
Christian Floro, CFA, CMT
Market Strategist
Jordan Rosner
Sr. Insights Strategist
Magdalena Ocampo
Market Strategist
Benjamin Brandsgard
Insights Strategist
Learn more about the factors impacting markets and portfolios in the quarter ahead by downloading the full PDF.
Bloomberg U.S. High-Yield Corporate Bond Index is a rules-based, market-value-weighted index engineered to measure publicly issued non-investment grade USD fixed-rate, taxable and corporate bonds.
Bloomberg U.S. Corp High Yield 2% Issuer Capped Index is an unmanaged index comprised of fixed rate, non-investment grade debt securities that are dollar denominated. The index limits the maximum exposure to any one issuer to 2%.
Bloomberg U.S. Corporate Investment Grade Index includes publicly issued U.S. corporate and specified foreign debentures and secured notes that meet the specified maturity, liquidity and quality requirements. To qualify, bonds must be SEC-registered. The corporate sectors are industrial, utility and finance, which include both U.S. and non-U.S. corporations.
Bloomberg U.S. Treasury Index measures U.S. dollar-denominated, fixed-rate, nominal debt issued by the U.S. Treasury. Treasury bills are excluded by the maturity constraint. STRIPS are excluded from the index because their inclusion would result in double-counting.
MSCI ACWI Index includes large and mid cap stocks across developed and emerging market countries.
MSCI Brazil Index is designed to measure the performance of the large and mid cap segments of the Brazilian market.
MSCI China Index captures large and mid cap representation across China A shares, H shares, B shares, Red chips, P chips and foreign listings (e.g. ADRs).
MSCI EAFE Index is listed for foreign stock funds (EAFE refers to Europe, Australasia, and Far East). Widely accepted as a benchmark for international stock performance, the EAFE Index is an aggregate of 21 individual country indexes.
MSCI Emerging Markets Index consists of large and mid cap companies across 24 countries and represents 10% of the world market capitalization. The index covers approximately 85% of the free float-adjusted market capitalization in each country in each of the 24 countries.
MSCI Europe Index captures large and mid cap representation across 15 Developed Markets (DM) countries in Europe.
MSCI Europe Banks Index is composed of large and mid cap stocks across 15 Developed Markets countries in Europe. All securities in the index are classified in the Banks industry group (within the Financials sector) according to the Global Industry Classification Standard (GICS®).
MSCI Germany Index is designed to measure the performance of the large and mid cap segments of the German market.
MSCI India Index is designed to measure the performance of the large and mid cap segments of the Indian market.
MSCI Japan Index is designed to measure the performance of the large and mid cap segments of the Japanese market.
MSCI United Kingdom Index is designed to measure the performance of the large and mid cap segments of the UK market.
MSCI USA Growth Index captures large and mid cap securities exhibiting overall growth style characteristics in the U.S. The growth investment style characteristics for index construction are defined using five variables: long-term forward EPS growth rate, short-term forward EPS growth rate, current internal growth rate and long-term historical EPS growth trend and long-term historical sales per share growth trend.
MSCI USA Index is a market capitalization weighted index designed to measure the performance of equity securities in the top 85% by market capitalization of equity securities listed on stock exchanges in the United States.
MSCI USA Large Cap Index is designed to measure the performance of the large cap segments of the U.S. market. MSCI USA Mid Cap Index is designed to measure the performance of the mid cap segments of the U.S. market.
MSCI USA Quality Index aims to capture the performance of quality growth stocks by identifying stocks with high quality scores based on three main fundamental variables: high return on equity (ROE), stable year-over-year earnings growth and low financial leverage. The MSCI Quality Indexes complement existing MSCI Factor Indexes and can provide an effective diversification role in a portfolio of factor strategies.
MSCI USA Small Cap Index is designed to measure the performance of the small cap segment of the U.S. equity market.
MSCI USA Value Index captures large and mid cap U.S. securities exhibiting overall value style characteristics. The value investment style characteristics for index construction are defined using three variables: book value to price, 12-month forward earnings to price and dividend yield.
Standard & Poor’s 500 Index is a market capitalization-weighted index of 500 widely held stocks often used as a proxy for the stock market.
U.S. dollar index (USDX) is a measure of the value of the U.S. dollar relative to a basket of foreign currencies.
Market indices have been provided for comparison purposes only. They are unmanaged and do not reflect any fees or expenses. Individuals cannot invest directly in an index.
Risk considerations
Investing involves risk, including possible loss of principal. Past performance is no guarantee of future results. Equity investments involve greater risk, including higher volatility, than fixed-income investments. Fixed-income investments are subject to interest rate risk; as interest rates rise their value will decline. International and global investing involves greater risks such as currency fluctuations, political/social instability and differing accounting standards. Small- and mid-cap stocks may have additional risks including greater price volatility. Asset allocation and diversification do not ensure a profit or protect against a loss.
Important information
This material covers general information only and does not take account of any investor’s investment objectives or financial situation and should not be construed as specific investment advice, a recommendation, or be relied on in any way as a guarantee, promise, forecast or prediction of future events regarding an investment or the markets in general. The opinions and predictions expressed are subject to change without prior notice. The information presented has been derived from sources believed to be accurate; however, we do not independently verify or guarantee its accuracy or validity. Any reference to a specific investment or security does not constitute a recommendation to buy, sell, or hold such investment or security, nor an indication that the investment manager or its affiliates has recommended a specific security for any client account. Subject to any contrary provisions of applicable law, the investment manager and its affiliates, and their officers, directors, employees, agents, disclaim any express or implied warranty of reliability or accuracy and any responsibility arising in any way (including by reason of negligence) for errors or omissions in the information or data provided.
This material may contain ‘forward-looking’ information that is not purely historical in nature and may include, among other things, projections and forecasts. There is no guarantee that any forecasts made will come to pass. Reliance upon information in this material is at the sole discretion of the reader.
This material is not intended for distribution to or use by any person or entity in any jurisdiction or country where such distribution or use would be contrary to local law or regulation.
This document is intended for use in:
- The United States by Principal Global Investors, LLC, which is regulated by the U.S. Securities and Exchange Commission.
- Europe by Principal Global Investors (Ireland) Limited, 70 Sir John Rogerson’s Quay, Dublin 2, D02 R296, Ireland. Principal Global Investors (Ireland) Limited is regulated by the Central Bank of Ireland. Clients that do not directly contract with Principal Global Investors (Europe) Limited (“PGIE”) or Principal Global Investors (Ireland) Limited (“PGII”) will not benefit from the protections offered by the rules and regulations of the Financial Conduct Authority or the Central Bank of Ireland, including those enacted under MiFID II. Further, where clients do contract with PGIE or PGII, PGIE or PGII may delegate management authority to affiliates that are not authorised and regulated within Europe and in any such case, the client may not benefit from all protections offered by the rules and regulations of the Financial Conduct Authority, or the Central Bank of Ireland. In Europe, this document is directed exclusively at Professional Clients and Eligible Counterparties and should not be relied upon by Retail Clients (all as defined by the MiFID).
- United Kingdom by Principal Global Investors (Europe) Limited, Level 1, 1 Wood Street, London, EC2V 7 JB, registered in England, No. 03819986, which is authorized and regulated by the Financial Conduct Authority (“FCA”).
- United Arab Emirates by Principal Investor Management (DIFC) Limited, an entity registered in the Dubai International Financial Centre and authorized by the Dubai Financial Services Authority as an Authorised Firm, in its capacity as distributor / promoter of the products and services of Principal Asset Management. This document is delivered on an individual basis to the recipient and should not be passed on or otherwise distributed by the recipient to any other person or organisation.
- Singapore by Principal Global Investors (Singapore) Limited (ACRA Reg. No. 199603735H), which is regulated by the Monetary Authority of Singapore and is directed exclusively at institutional investors as defined by the Securities and Futures Act 2001. This advertisement or publication has not been reviewed by the Monetary Authority of Singapore.
- Australia by Principal Global Investors (Australia) Limited (ABN 45 102 488 068, AFS Licence No. 225385), which is regulated by the Australian Securities and Investments Commission and is only directed at wholesale clients as defined under Corporations Act 2001.
- This document is marketing material and is issued in Switzerland by Principal Global Investors (Switzerland) GmbH.
- Hong Kong SAR (China) by Principal Asset Management Company (Asia) Limited, which is regulated by the Securities and Futures Commission. This document has not been reviewed by the Securities and Futures Commission.
- Other APAC Countries/Jurisdictions, this material is issued for institutional investors only (or professional/sophisticated/qualified investors, as such term may apply in local jurisdictions) and is delivered on an individual basis to the recipient and should not be passed on, used by any person or entity in any jurisdiction or country where such distribution or use would be contrary to local law or regulation.
- Nothing in this document is, and shall not be considered as, an offer of financial products or services in Brazil. This presentation has been prepared for informational purposes only and is intended only for the designated recipients hereof. Principal Global Investors is not a Brazilian financial institution and is not licensed to and does not operate as a financial institution in Brazil. This document is intended for use in Brazil by Principal Asset Management Ltda., a Brazilian asset manager licensed and authorized to carry out its activities in Brazil according to Declaratory Act n. 9.408/07. This document is delivered on an individual basis to the recipient and should not be passed on or otherwise distributed by the recipient to any other person or organisation.
Insurance products and plan administrative services provided through Principal Life Insurance Co. Principal Funds, Inc. is distributed by Principal Funds Distributor, Inc. Securities are offered through Principal Securities, Inc., 800‐547‐7754, Member SIPC and/or independent broker/dealers. Principal Life, Principal Funds Distributor, Inc., and Principal Securities are members of the Principal Financial Group®, Des Moines, IA 50392.
© 2025, Principal Financial Services, Inc. Principal Asset Management℠ is a trade name of Principal Global Investors, LLC. Principal®, Principal Financial Group®, Principal Asset Management, and Principal and the logomark design are registered trademarks and service marks of Principal Financial Services, Inc., a Principal Financial Group company, in various countries around the world and may be used only with the permission of Principal Financial Services, Inc.
4881123