Three reasons to consider buying listed REITs:
  1. Interest rate headwinds are fading and REITs have outperformed after real yields peak or fall.
  2. Growth is slowing and REITs have outperformed in the slowdown phase of the business cycle.
  3. REIT valuations are attractive relative to equities after the big sell-off in 2022.

In 2023, the combination of peaking real yields, slowing economic growth, and attractive relative valuations makes a compelling case for an allocation to listed REITs versus equities.

We believe the cycle of U.S. Federal Reserve (Fed) tightening and more importantly, rising long-term real yields, has entered the late stages. As a result, the playbook of REITs outperforming when interest rate headwinds fade is starting to repeat itself.

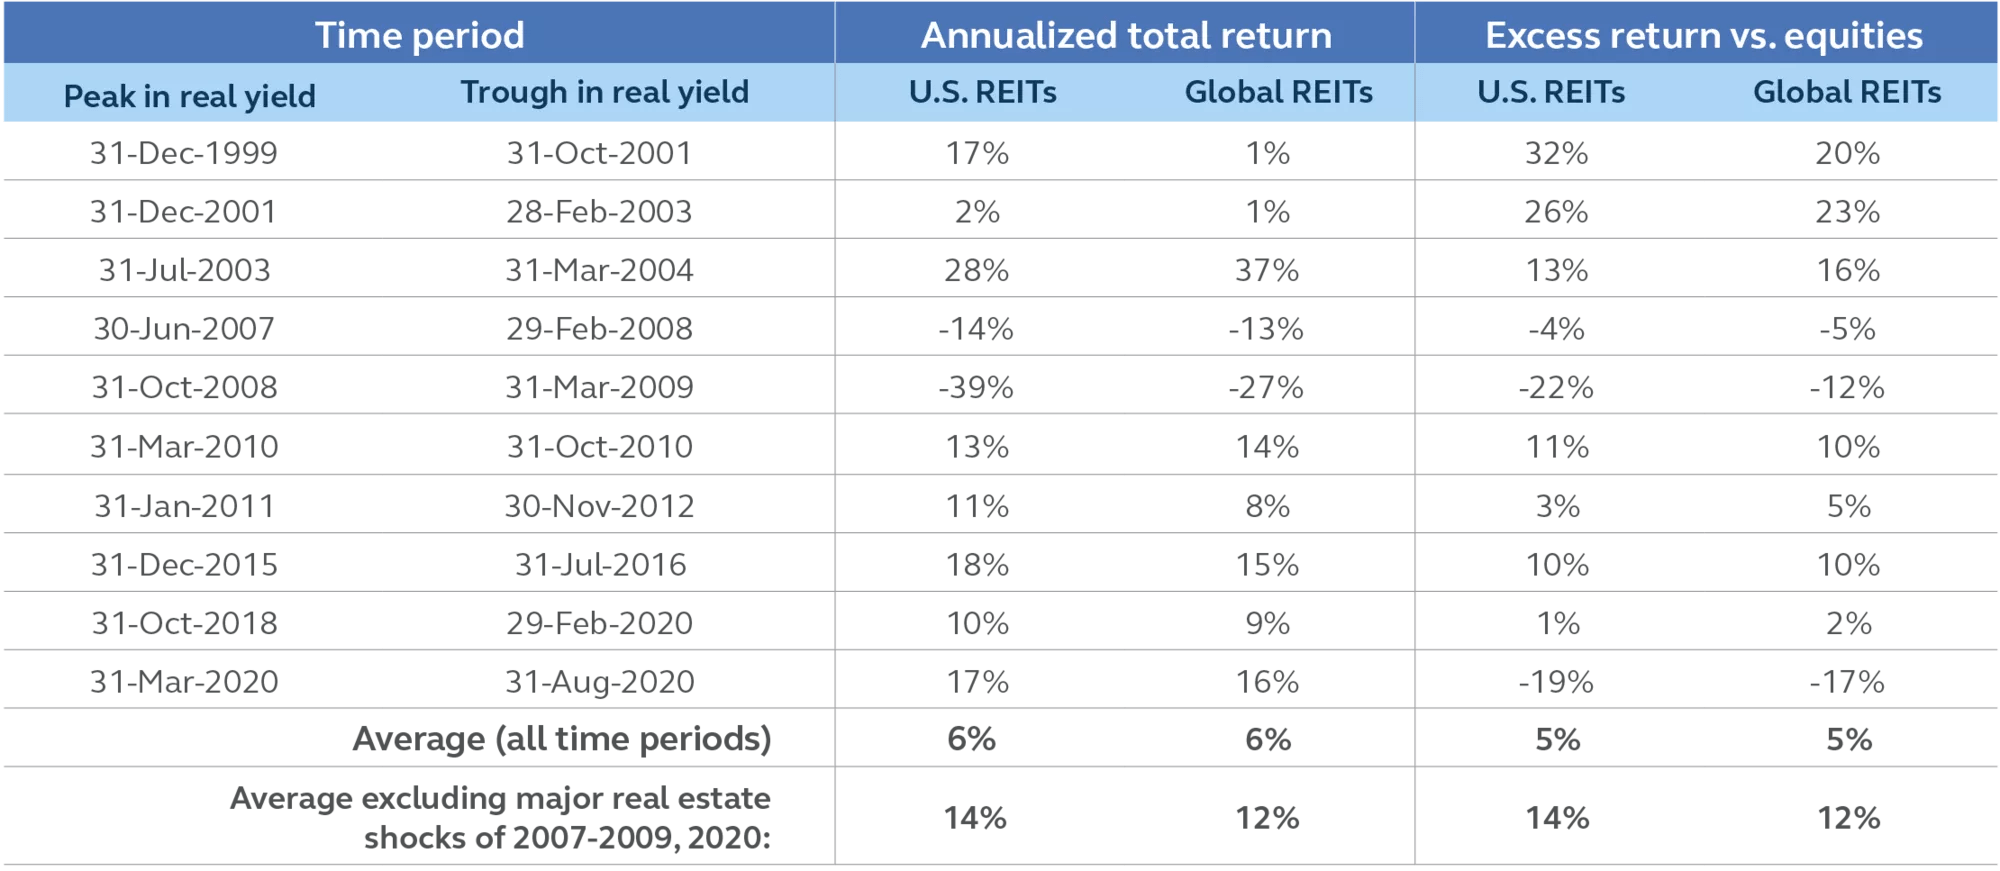
The reason why is that REITs typically behave as higher duration equity given their visible and durable income streams generated from medium to long-term lease periods. This cash flow profile is advantageous when the economy slows and contributes to the overall sensitivity REITs possess with long- term real yields. In our view, this will be supportive for REITs relative to other equities as real yields peak (see Exhibit 1) or possibly decline (Exhibit 2) over this year.

EXHIBIT 1: Average 12 month returns after a peak in real yields

Bar charts of U.S. REITs and Global REITs showing total returns and excess returns vs. equities

As of 31 January 2023. Source: FactSet. Returns data is showing FTSE NAREIT Equity REITs Index (U.S. REITs) and FTSE EPRA/NAREIT Developed Index (global REITs) average annualized total and excess returns over the S&P 500 Index (U.S. equities) and MSCI World Index (global equities), respectively, after the last 7 periods of rising real yields have peaked (an increase of at least 75 bps represented by the US 10-year TIPS). The latest period after real yields peaked on 30 September 2022 is broken out separately and is less than a 12 month period. Analysis goes back to January 1997, the inception of U.S. TIPs bond market. Past performance does not guarantee future results. Indices are unmanaged and do not take into account fees, expenses, and transaction costs and it is not possible to invest in an index. See important information for index descriptions.

EXHIBIT 2: Returns from listed REITs during periods of falling real yields

Table of returns from listed REITs during periods of falling real yields

As of 31 January 2023. Source: FactSet. Returns data is showing FTSE NAREIT Equity REITs Index (U.S. REITs) and FTSE EPRA/NAREIT Developed Index (global REITs) average annualized total and excess returns over the S&P 500 Index (U.S. equities) and MSCI World Index (global equities), respectively, after periods of falling real yields (a decrease of at least 75 bps represented by the US 10-year TIPS). Analysis goes back to January 1997, the inception of U.S. TIPs bond market. Past performance does not guarantee future results. Indices are unmanaged and do not take into account fees, expenses, and transaction costs and it is not possible to invest in an index. See important information for index descriptions.

REITs have outperformed in the slowdown phase of the business cycle

Restrictive monetary policy has created a slowdown in growth. The long duration and staggered nature of property leases over multiple years may help insulate REIT earnings against a weakening economy. This allows embedded rent growth late into a business cycle as the leases coming due can still be renewed at premiums to the last signed rents from years prior. The defensive and durable income streams of REITs can look appealing during this part of the cycle and REITs have historically outperformed the S&P 500 during this phase.

EXHIBIT 3: Total returns during different phases of the business cycle
Average annualized returns since 1990

Bar chart showing total returns during different phases of the business cycle from 1990

As of 31 January 2023. Source: The Conference Board Leading Economic Index (LEI), National Bureau of Economic Research (NBER), FactSet. LEI and NBER were utilized to identify business cycle phases since 1990. Returns data is showing average annualized returns that occurred from the FTSE NAREIT Equity REITS Index (U.S. REITs) and S&P 500 Index (U.S. equities) indices during each phase. Past performance does not guarantee future results. Indices are unmanaged and do not take into account fees, expenses, and transaction costs and it is not possible to invest in an index. See important information for index descriptions.

Currently, it is our base expectation that the economy is continuing a path towards a moderate recession in 2023. Going into this potential recession, it is our view REITs may perform well relative to equities because of healthy balance sheets, resilient demand in sectors that benefit from less economically sensitive structural demand drivers, and generally low supply conditions.

It's important to take note every recession is different and so too was the corresponding performance of REITs. The last two recessions had an outsized negative impact on REITs: the credit crisis in 2008-09 really hurt a capital heavy sector like real estate and in 2020, COVID social distancing efforts restricted the use of many forms of real estate. However, in the other two U.S. recessions since 1990, REITs performed well and outperformed the S&P 500.

EXHIBIT 4: No two recessions are the same
Average annualized returns

Bar chart showing average annualized returns of U.S. REITs and U.S. equities during different recessions

As of 31 January 2023. Source: National Bureau of Economic Research (NBER), FactSet. NBER was utilized to identify past recessions since 1990. Returns data is showing average annualized returns realized during these recession periods from the FTSE NAREIT Equity REITS Index (U.S. REITs) and S&P 500 Index (U.S. equities) indices. Past performance does not guarantee future results. Indices are unmanaged and do not take into account fees, expenses, and transaction costs and it is not possible to invest in an index. See important information for index descriptions.

Listed REITs are trading at a bargain compared to general equities

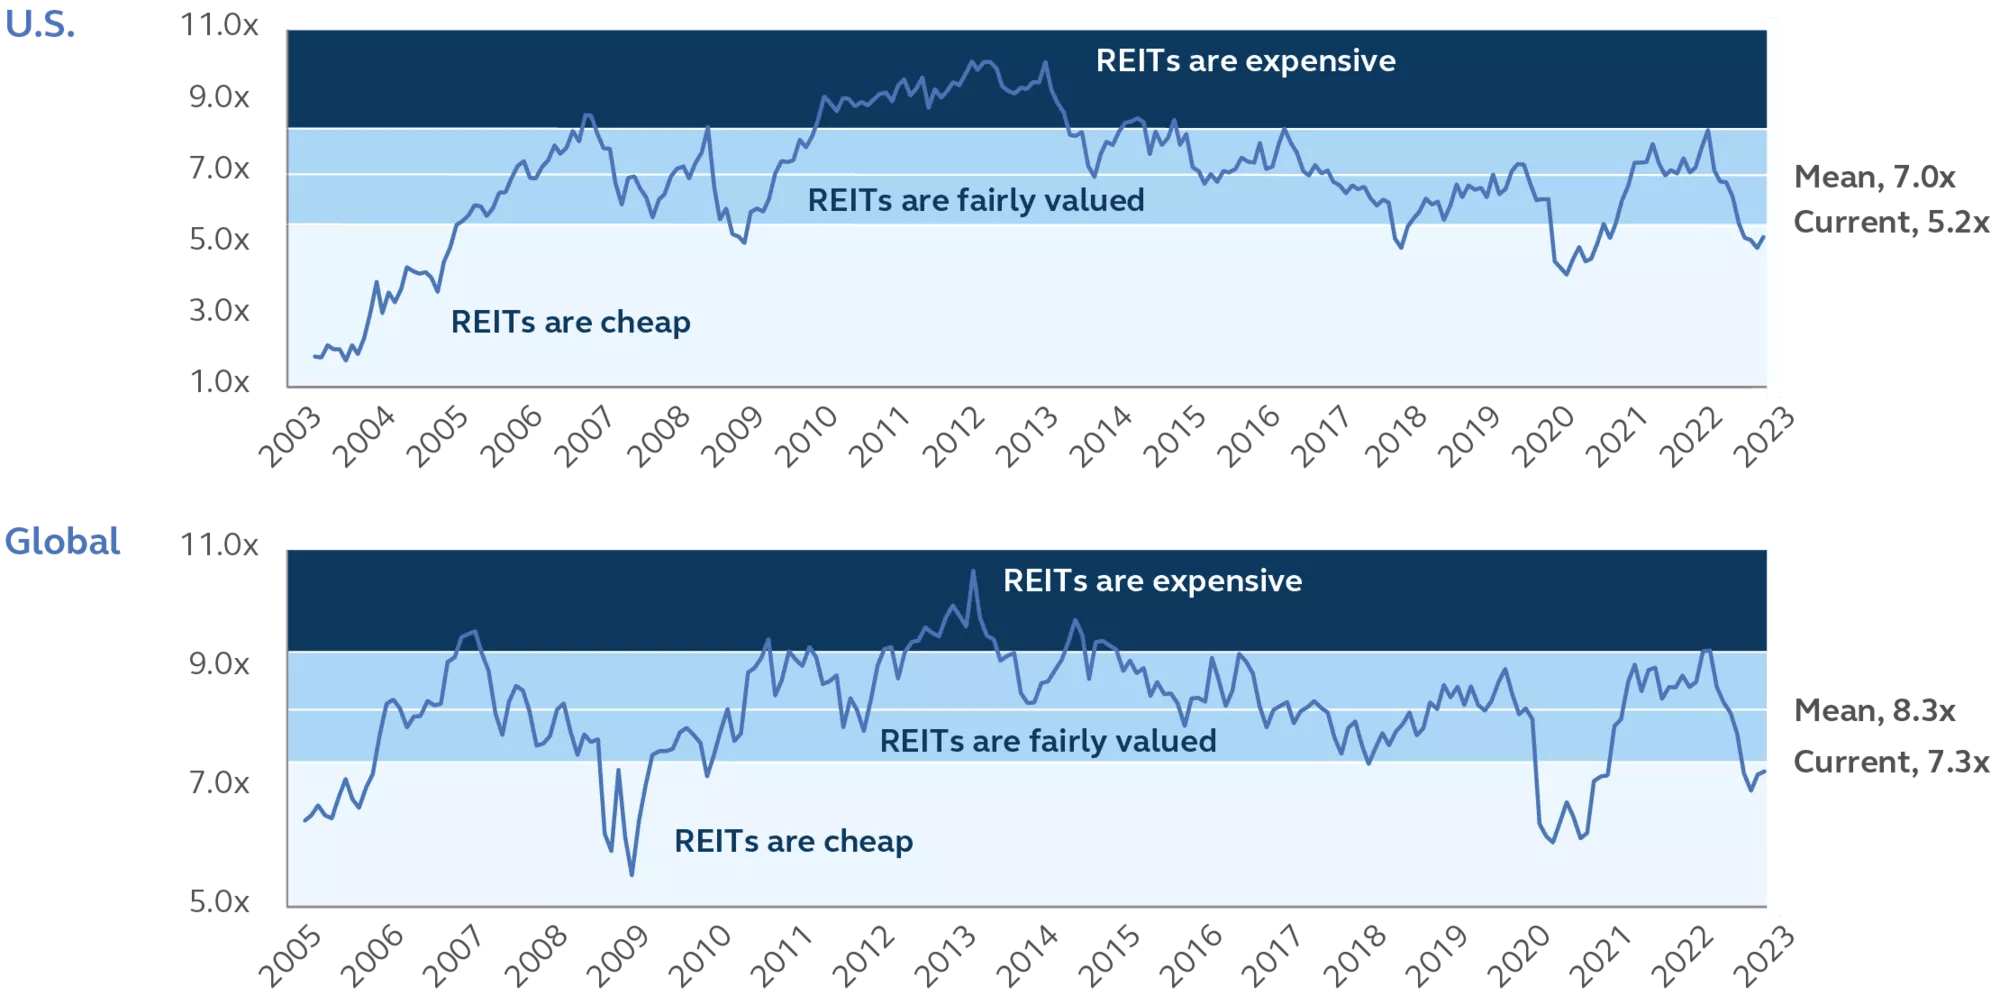
In 2022, public REIT share prices repriced lower for higher yields and tighter financial conditions. Given the underperformance for the past year, REITs are looking historically cheap relative to equities, with price multiple spreads over one standard deviation away from the mean (in other words, historically REITs have been this cheap relative to equities only 16% of the time). Combined with fading rate headwinds and steady cash flows in a slowing environment, we believe the time is now to overweight REITs relative to equities.

EXHIBIT 5: REITs are in "cheap" territory relative to equities
Difference (spread) in EV/EBITDA multiples: REITs minus equities

Line graphs of U.S. and Global REITs valuations from 2003-2023

As of 31 January 2023. Source: FactSet. Enterprise Value (EV) to EBITDA price multiples are used to measure valuations. The spread plotted is the EV/EBITDA of the MSCI US REIT index minus the EV/EBITDA of the S&P 500 Index (chart 1) and the FTSE EPRA/NAREIT Developed Index minus the EV/EBITDA of the MSCI World index (chart 2). Expensive and cheap valuations are represented by spreads higher or lower than one standard deviation from the mean, respectively. Fair value is represented by valuations between one standard deviation from the mean. See important information for index descriptions.

Disclosure

For Public Distribution in the U.S. For Institutional, Professional, Qualified and/or Wholesale Investor Use Only in other Permitted Jurisdictions as defined by local laws and regulations.

Risk Considerations
Past performance is no guarantee of future results. Investing involves risk, including possible loss of principal. Potential investors should be aware of the many risks inherent to investing in real estate, including: value fluctuations, default risk, liquidity risks, leverage, credit risk, occupancy risk and legal risk. All these risks can lead to a decline in the value of the real estate, a decline in the income produced by the real estate and declines in the value or total loss in value of securities derived from investments in real estate. REIT securities are subject to risk factors associated with the real estate industry and tax factors of REIT registration.

International and global investing involves greater risks such as currency fluctuations, political/social instability and differing accounting standards.

Important information
This material covers general information only and does not take account of any investor’s investment objectives or financial situation and should not be construed as specific investment advice, a recommendation, or be relied on in any way as a guarantee, promise, forecast or prediction of future events regarding an investment or the markets in general. The opinions and predictions expressed are subject to change without prior notice. The information presented has been derived from sources believed to be accurate; however, we do not independently verify or guarantee its accuracy or validity. Any reference to a specific investment or security does not constitute a recommendation to buy, sell, or hold such investment or security, nor an indication that the investment manager or its affiliates has recommended a specific security for any client account. Subject to any contrary provisions of applicable law, the investment manager and its affiliates, and their officers, directors, employees, agents, disclaim any express or implied warranty of reliability or accuracy and any responsibility arising in any way (including by reason of negligence) for errors or omissions in the information or data provided. All figures shown in this document are in U.S. dollars unless otherwise noted. Investing involves risk, including possible loss of principal.

This material may contain ‘forward looking’ information that is not purely historical in nature. Such information may include, among other things, projections and forecasts. There is no guarantee that any forecasts made will come to pass. Reliance upon information in this material is at the sole discretion of the reader.

Index descriptions: FTSE NAREIT Equity REITs Index is a free-float adjusted, market capitalization-weighted index of U.S. equity REITs. FTSE EPRA/NAREIT Developed Index is a free-float adjusted, market capitalization-weighted index designed to track the performance of listed real estate companies in both developed and emerging countries worldwide. S&P 500 Index tracks 500 publicly traded domestic companies. MSCI World Index is a broad global equity index that represents large and mid-cap equity performance across all 23 developed markets countries. It covers approximately 85% of the free float-adjusted market capitalization in each country. This material is not intended for distribution to or use by any person or entity in any jurisdiction or country where such distribution or use would be contrary to local law or regulation.

This document is issued in:

  • The United States by Principal Global Investors, LLC, which is regulated by the U.S. Securities and Exchange Commission.
  • Europe by Principal Global Investors (EU) Limited, Sobo Works, Windmill Lane, Dublin D02 K156, Ireland. Principal Global Investors (EU) Limited is regulated by the Central Bank of Ireland. In Europe, this document is directed exclusively at Professional Clients and Eligible Counterparties and should not be relied upon by Retail Clients (all as defined by the MiFID). The contents of the document have been approved by the relevant entity. Clients that do not directly contract with Principal Global Investors (Europe) Limited (“PGIE”) or Principal Global Investors (EU) Limited (“PGI EU”) will not benefit from the protections offered by the rules and regulations of the Financial Conduct Authority or the Central Bank of Ireland, including those enacted under MiFID II. Further, where clients do contract with PGIE or PGI EU, PGIE or PGI EU may delegate management authority to affiliates that are not authorized and regulated within Europe and in any such case, the client may not benefit from all protections offered by the rules and regulations of the Financial Conduct Authority, or the Central Bank of Ireland.
  • United Kingdom by Principal Global Investors (Europe) Limited, Level 1, 1 Wood Street, London, EC2V 7 JB, registered in England, No. 03819986, which is authorised and regulated by the Financial Conduct Authority (“FCA”).
  • United Arab Emirates by Principal Global Investors LLC, a branch registered in the Dubai International Financial Centre and authorized by the Dubai Financial Services Authority as a representative office and is delivered on an individual basis to the recipient and should not be passed on or otherwise distributed by the recipient to any other person or organisation.
  • Singapore by Principal Global Investors (Singapore) Limited (ACRA Reg. No. 199603735H), which is regulated by the Monetary Authority of Singapore and is directed exclusively at institutional investors as defined by the Securities and Futures Act 2001. This advertisement or publication has not been reviewed by the Monetary Authority of Singapore.
  • Australia by Principal Global Investors (Australia) Limited (ABN 45 102 488 068, AFS Licence No. 225385), which is regulated by the Australian Securities and Investments Commission. This document is intended for sophisticated institutional investors only.
  • This document is marketing material and is issued in Switzerland by Principal Global Investors (Switzerland) GmbH.
  • Hong Kong SAR (China) by Principal Asset Management Company (Asia) Limited, which is regulated by the Securities and Futures Commission and is directed exclusively at professional investors as defined by the Securities and Futures Ordinance.
  • Other APAC Countries, this material is issued for institutional investors only (or professional/sophisticated/qualified investors, as such term may apply in local jurisdictions) and is delivered on an individual basis to the recipient and should not be passed on, used by any person or entity in any jurisdiction or country where such distribution or use would be contrary to local law or regulation.

Principal Funds are distributed by Principal Funds Distributor, Inc.

© 2023 Principal Financial Services, Inc. Principal®, Principal Financial Group®, Principal Asset Management, and Principal and the logomark design are registered trademarks and service marks of Principal Financial Services, Inc., a Principal Financial Group company, in various countries around the world and may be used only with the permission of Principal Financial Services, Inc. Principal Asset ManagementSM is a trade name of Principal Global Investors, LLC. Principal Real Estate is a is a trade name of Principal Real Estate Investors, LLC, an affiliate of Principal Global Investors.

MM13310 | 02/2023 | 2737396-122024

About the author