In the third quarter of 2022, equity markets continued to lose ground for the third consecutive quarter as global indices remained down anywhere from 15% to 25%. Markets are grappling with simultaneously mounting dangers, as financial conditions continue to tighten while economic growth weakens. Equity markets could likely continue sliding over the coming months, as central banks continue tightening monetary policy and global growth draws closer to recession. With no respite in sight, the biggest question on investors’ mind remains: When will the market bottom?

Immediate market outlook: Earnings weakness ahead
The 2022 bear market was initially spurred by an inflation scare, resulting in lower valuations. This scare was extended through the year amid a surge in bond yields, as central banks emphasized their intentions to continue aggressively raising policy rates. As such, it’s likely the current prolonged equity drawdown has not yet confronted the potentially severe risks to the wider economy and corporate earnings. Despite robust stock selloffs, aggregate earnings estimates have barely budged, and the S&P 500 was down 25% at its low ahead of the 3Q22 earnings season.
The global macroeconomic backdrop continues to deteriorate, pointing to the risk of earnings weakness ahead. Central bank liquidity, an important driver of economic activity in the post-Global Financial Crisis (GFC) era, has seen a sharp and significant reversal from 2021. Over 200 separate occasions of global central bank rate hikes have occurred since 2021, which will inevitably restrict economic activity and challenge corporate operating leverage and profitability in 2023.
Global Manufacturing PMIs and global rate cuts
Monthly net rate cuts, negative = rate hikes
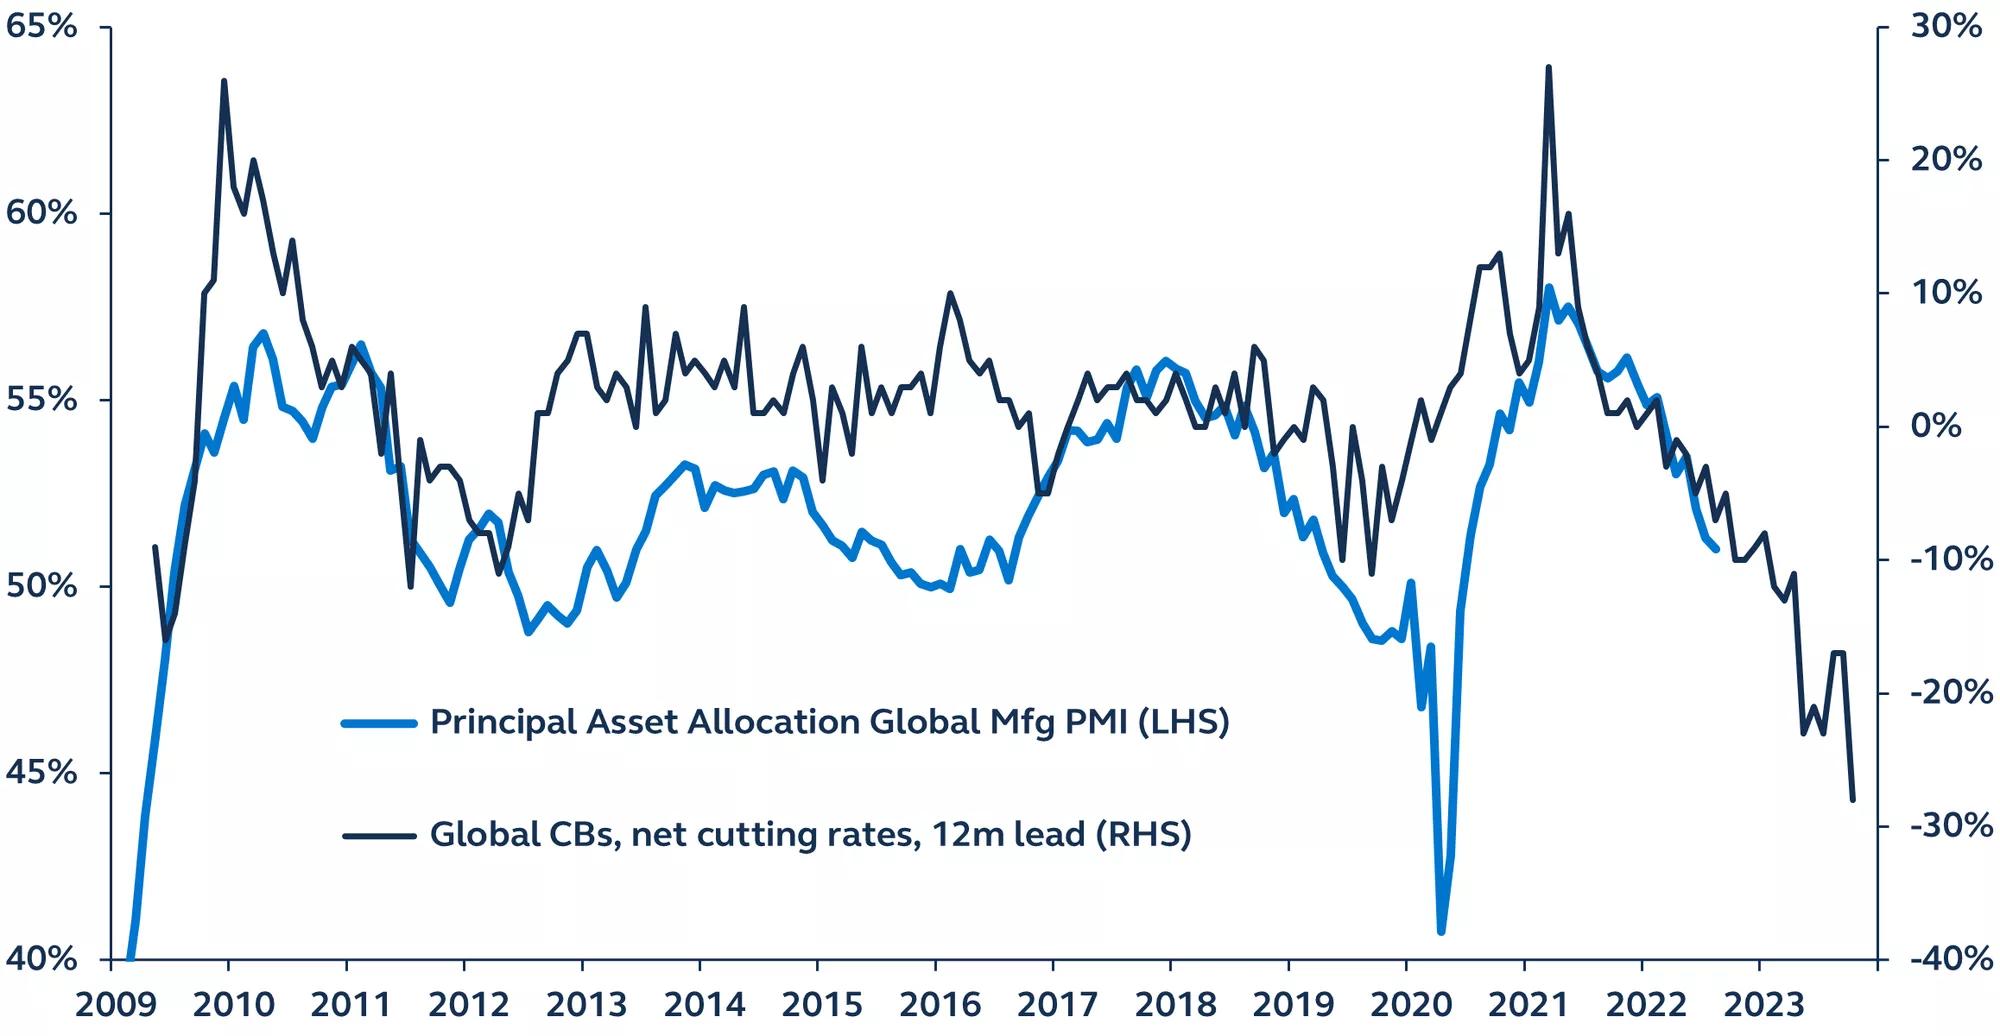
Bank for International Settlements, Bloomberg, Principal Asset Management. Data as of August 31, 2022.
Although significantly slower than in 2021, earnings growth so far in 2022 has been relatively robust, but there’s a substantial risk that the deterioration in the macro backdrop will eventually result in an earnings contraction. While corporate margins remain at record levels, consumer and wage inflation, paired with whipsawing inventory cycles, indicate that a profitability slowdown will continue in 2023, flagging a potential earnings recession.
Taken together, a strong U.S. dollar, high energy prices, rising wage costs, and a hawkish Federal Reserve (Fed) determined to slow demand and fight off inflation, leading indicators not only suggest a profit slowdown, but also a potential outright decline. Currently, earnings estimates do not incorporate these abundant risks, but top-line contractions will likely permeate to margin pressures and eventually negatively impact bottom-line corporate earnings. While inflation and tighter Fed policy have thus far precipitated this year’s equities drawdown, the bear market’s second act could be the realization of inherent economic and profit growth concerns.
Small business optimism and operating margin
Level, 1991–present
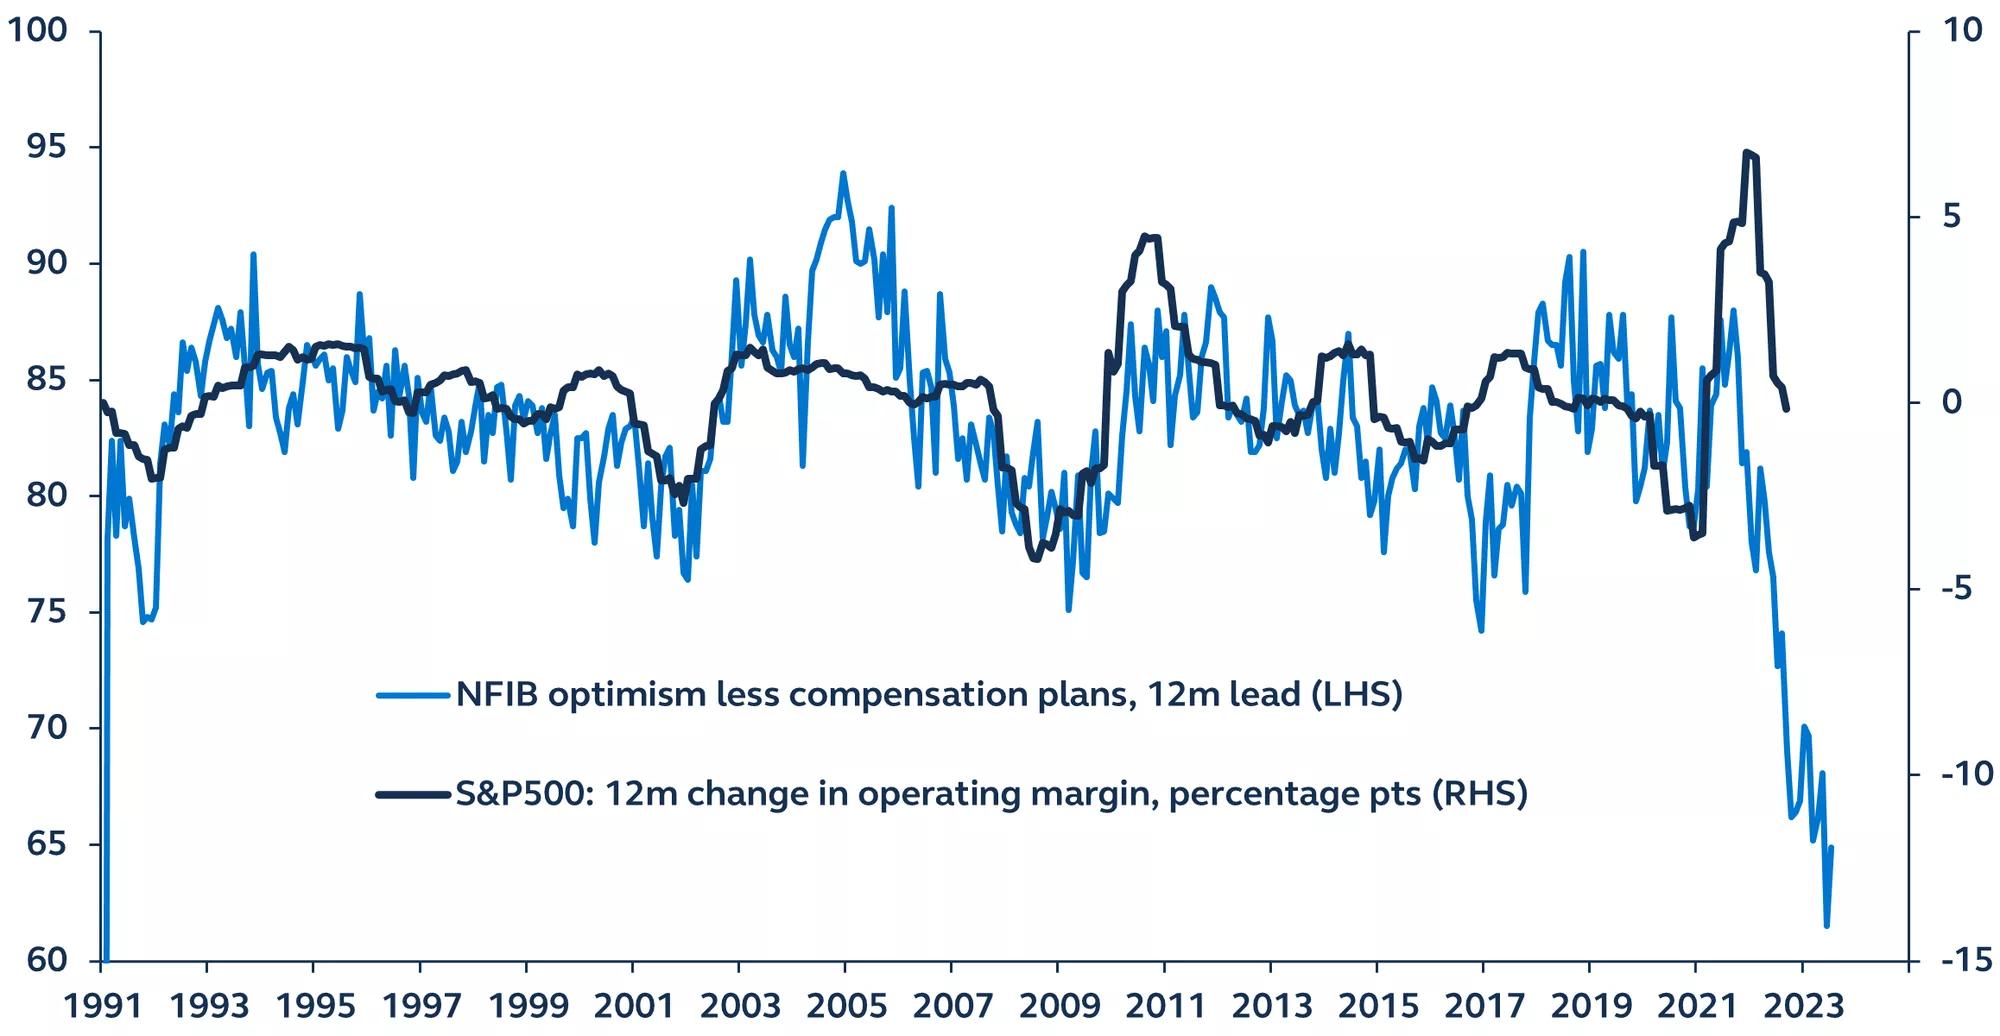
National Federation of Independent Business, S&P Down Jones, Bloomberg, Principal Asset Management. Data as of October 21, 2022.
Where to focus: Average magnitude and timing of declines
As analysts increasingly adopt the idea that earnings growth is about to slow and negatively impact equities, investor focus is shifting to the likely magnitude of a further decline and the timing of a market bottom.
Market drawdowns greater than 10%
S&P 500 Index, 1965–present
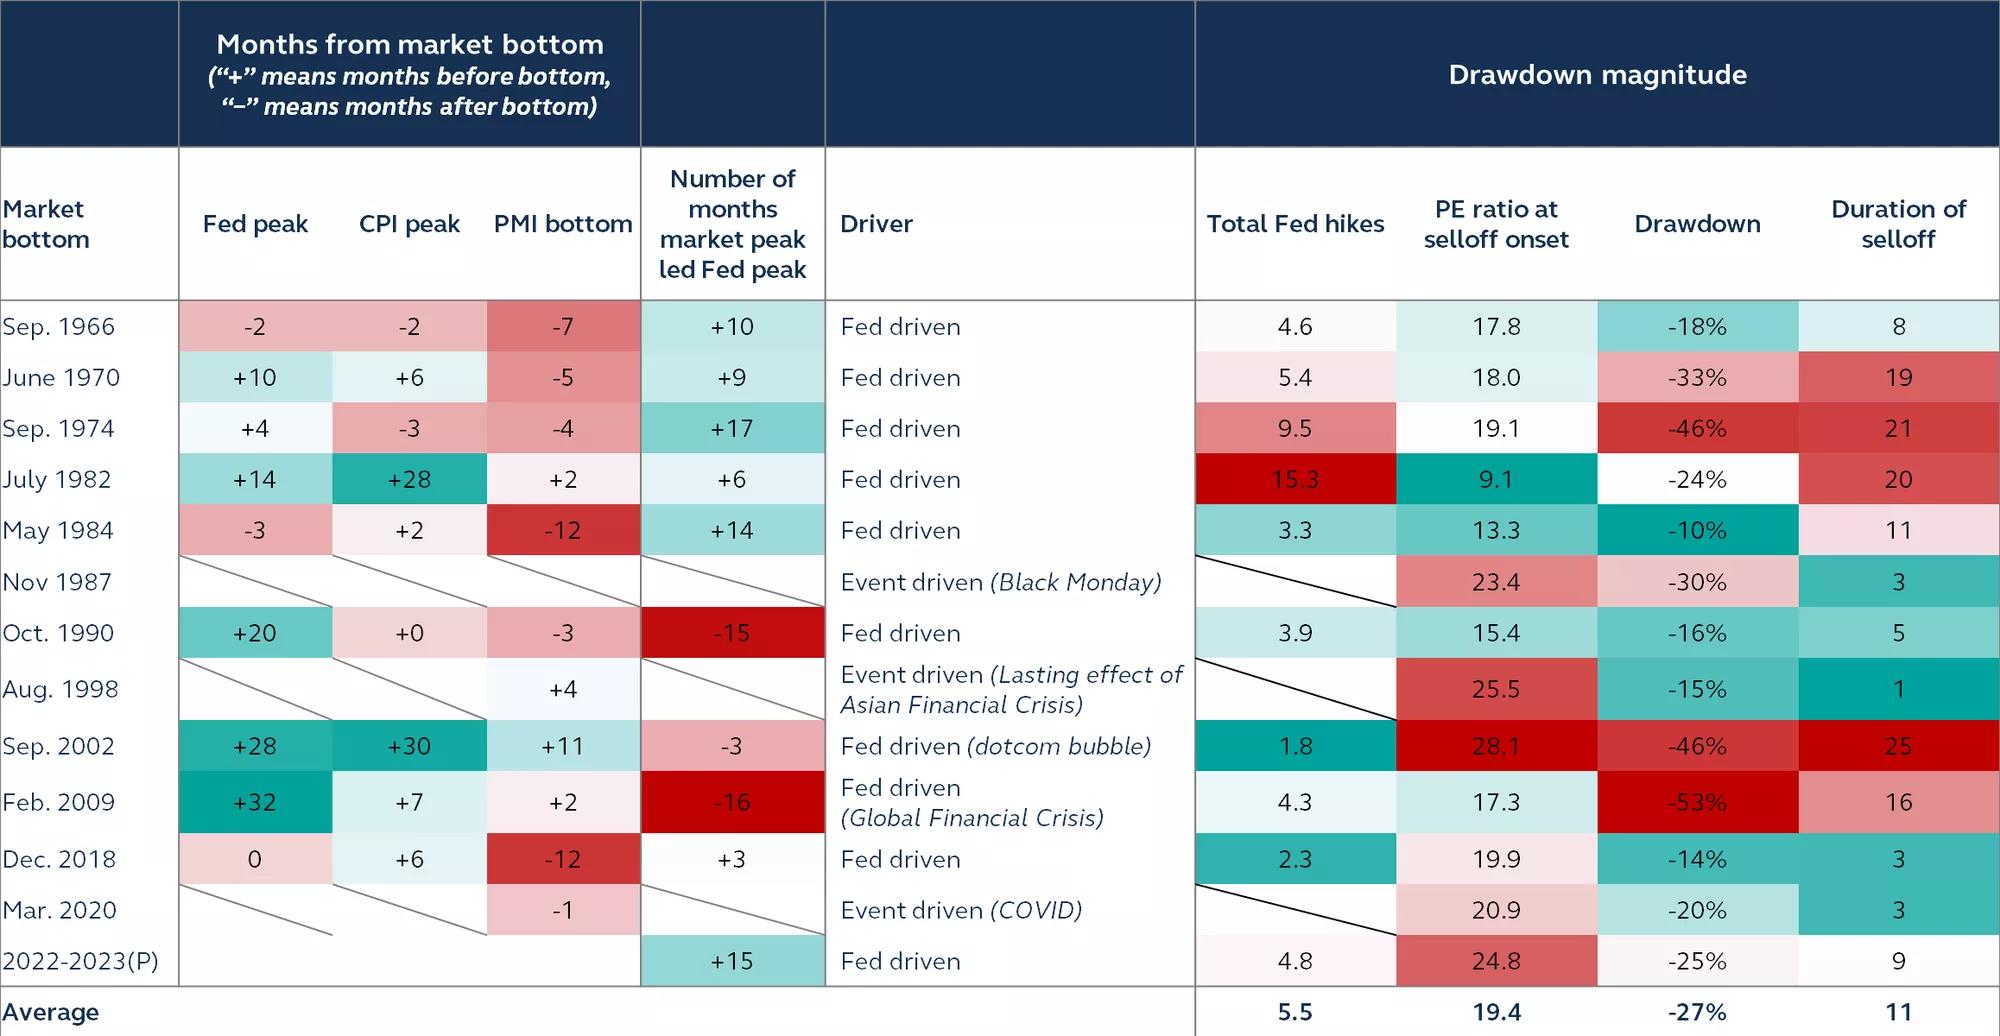
Bloomberg, Principal Asset Management. Data as of October 20, 2022.
To identify patterns leading up to a market trough, we examined all market drawdowns greater than 10% since 1965, with a focus on magnitude and timing. Some key findings include:
- With a few notable exceptions (1974 Fed rate increases, 2002 dotcom bubble, and 2009 GFC), drawdowns rarely exceeded -30%, and most clustered around -15% to -25%.
- Since the 1960s, the average market drawdown was 27%. The largest on record was 53%, during the GFC.
- Global markets today are not displaying the imbalances of the GFC period, suggesting that the current drawdown could indeed be lower, but not as bad as 2008 losses. If this is true, we are likely already more than halfway through the current market drawdown.
Timing a market floor
Examining the timing and level of historical Fed rate peaks can also be instructive.
- In recent bear markets, such as 1990, 2002, 2009, and 2018, market selloffs started around the same time as Fed policy rates peaked, or in the months shortly thereafter—a very different situation to the current sell-off that got underway several months before the Fed even started to tighten monetary policy.
- The current Fed hiking cycle is more like those before 1985, when the market would typically begin to fall long before the Fed peaked. Consequently, the market floor was typically reached either very close to, or in the months following Fed funds hitting their peak.
The Fed has never paused a rate hiking cycle while the Fed funds rate was lower than annual core PCE inflation. Or, in other words, the Fed has only ever stopped hiking once the real Fed funds rate is in positive territory.
Core Personal Consumption Expenditures (PCE) and the federal funds target rate
1974 – present
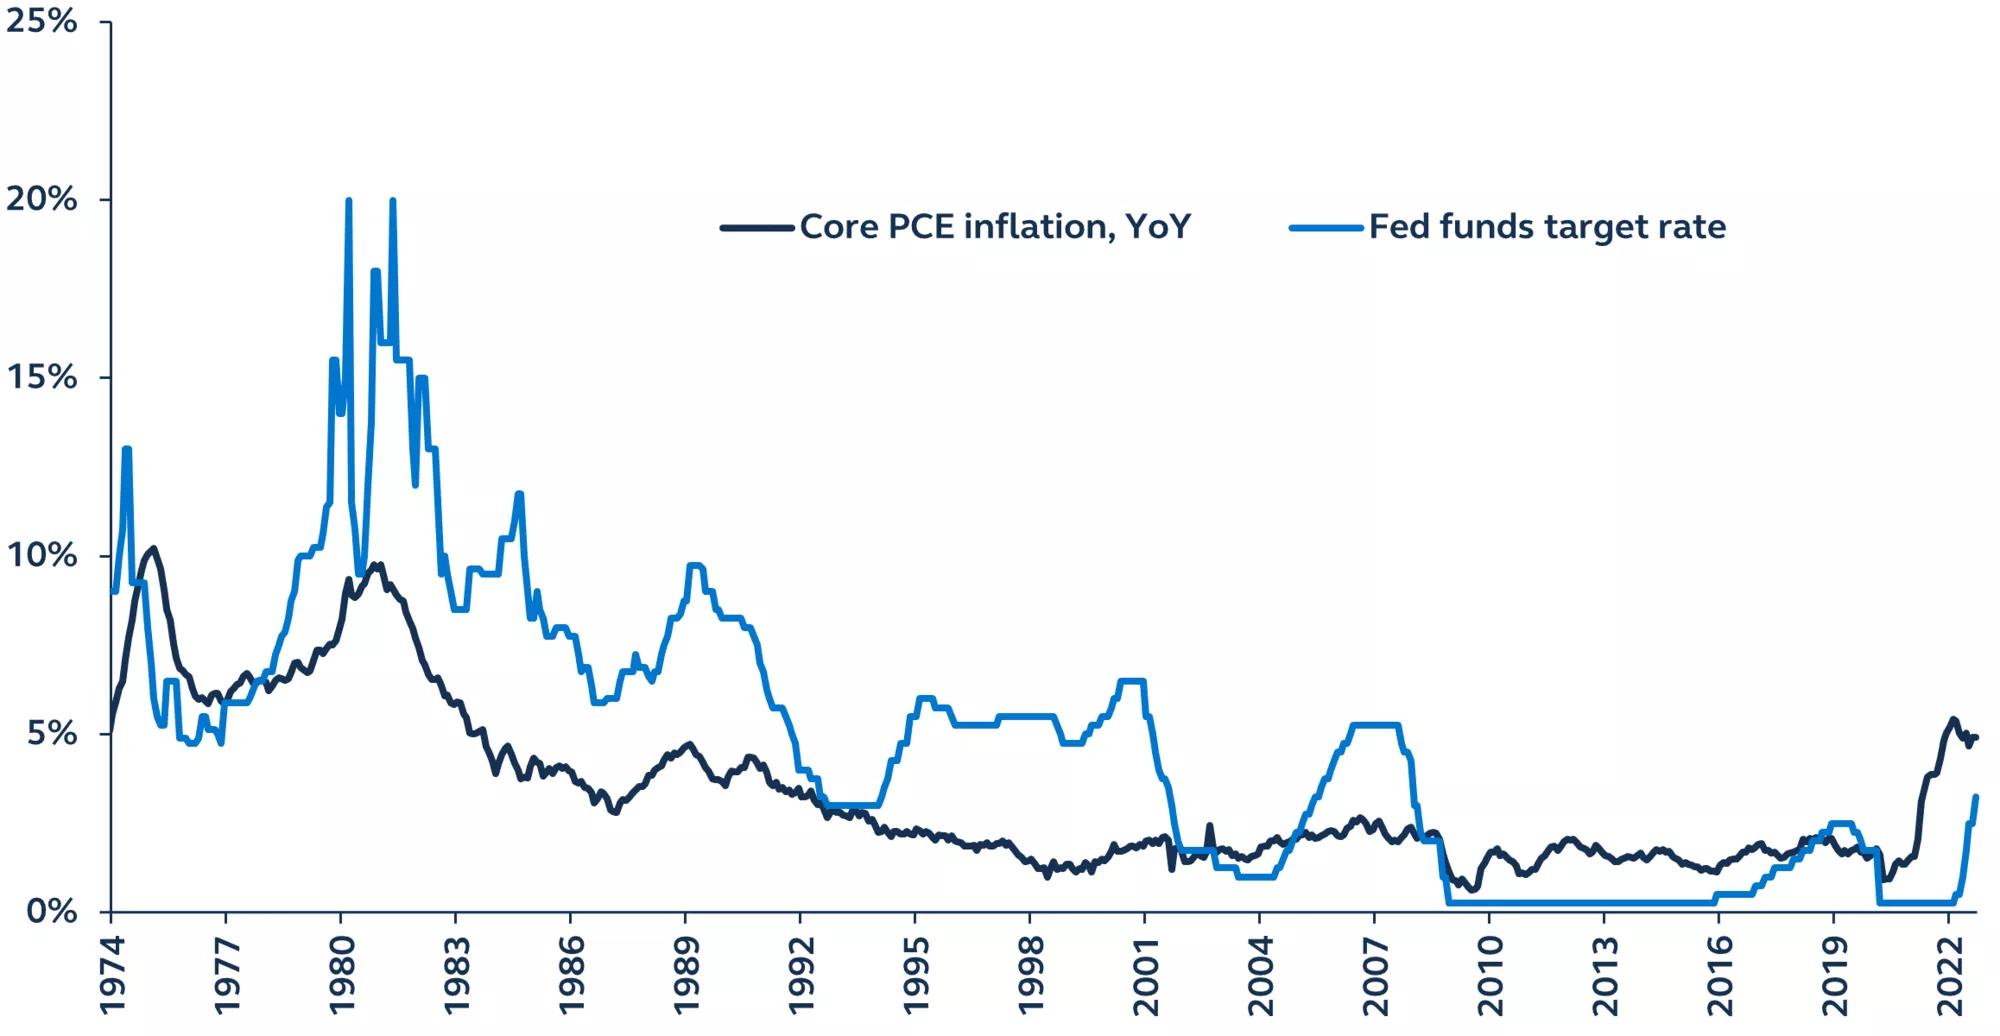
St. Louis Fed, Federal Reserve, Principal Asset Management. Data as of September 30, 2022.
Examining the monthly path of core PCE inflation offers indications as to when the Fed may be able to stop tightening. The average monthly core PCE inflation rate over the past three months has been 0.4%, equal to the post-COVID period average.
This leaves three potential inflation path scenarios:
- Optimistic Bull. If core PCE reverts to its long-term monthly average of 0.16% immediately, annual core PCE could be pushed lower quickly, falling from 4.9% to 3.8% by year-end. Assuming the Fed hikes rates by another 75 basis points in November, the Fed funds rate would exceed core PCE before year-end, thus permitting the Fed to stop hiking rates. However, with the latest monthly PCE inflation having printed 0.6%, this scenario seems unlikely.
- Realistic Base. If core PCE inflation remains near the post-COVID monthly average of 0.4%, annual core PCE would likely continue to exceed the Fed funds rate through the remainder of this year. Assuming the Fed raises policy rates by 75 bps in November and 50 bps in December (as the rates futures market is currently pricing), the Fed would need to raise rates by another 50 bps before policy rates would exceed core PCE inflation. In this scenario, we could have a Fed pause as early as February 2023, paving the way for an equity market trough early next year.
- Pessimistic Bear. If the core PCE monthly rate accelerates even slightly to 0.45%, the Fed would need to deliver another run of 75 bps hikes to preserve its credibility of taming inflation before the middle of next year. This would likely extend and deepen the 2022 equity market downturn into 2023.
Projected core PCE and the federal funds rate
July 2022–present
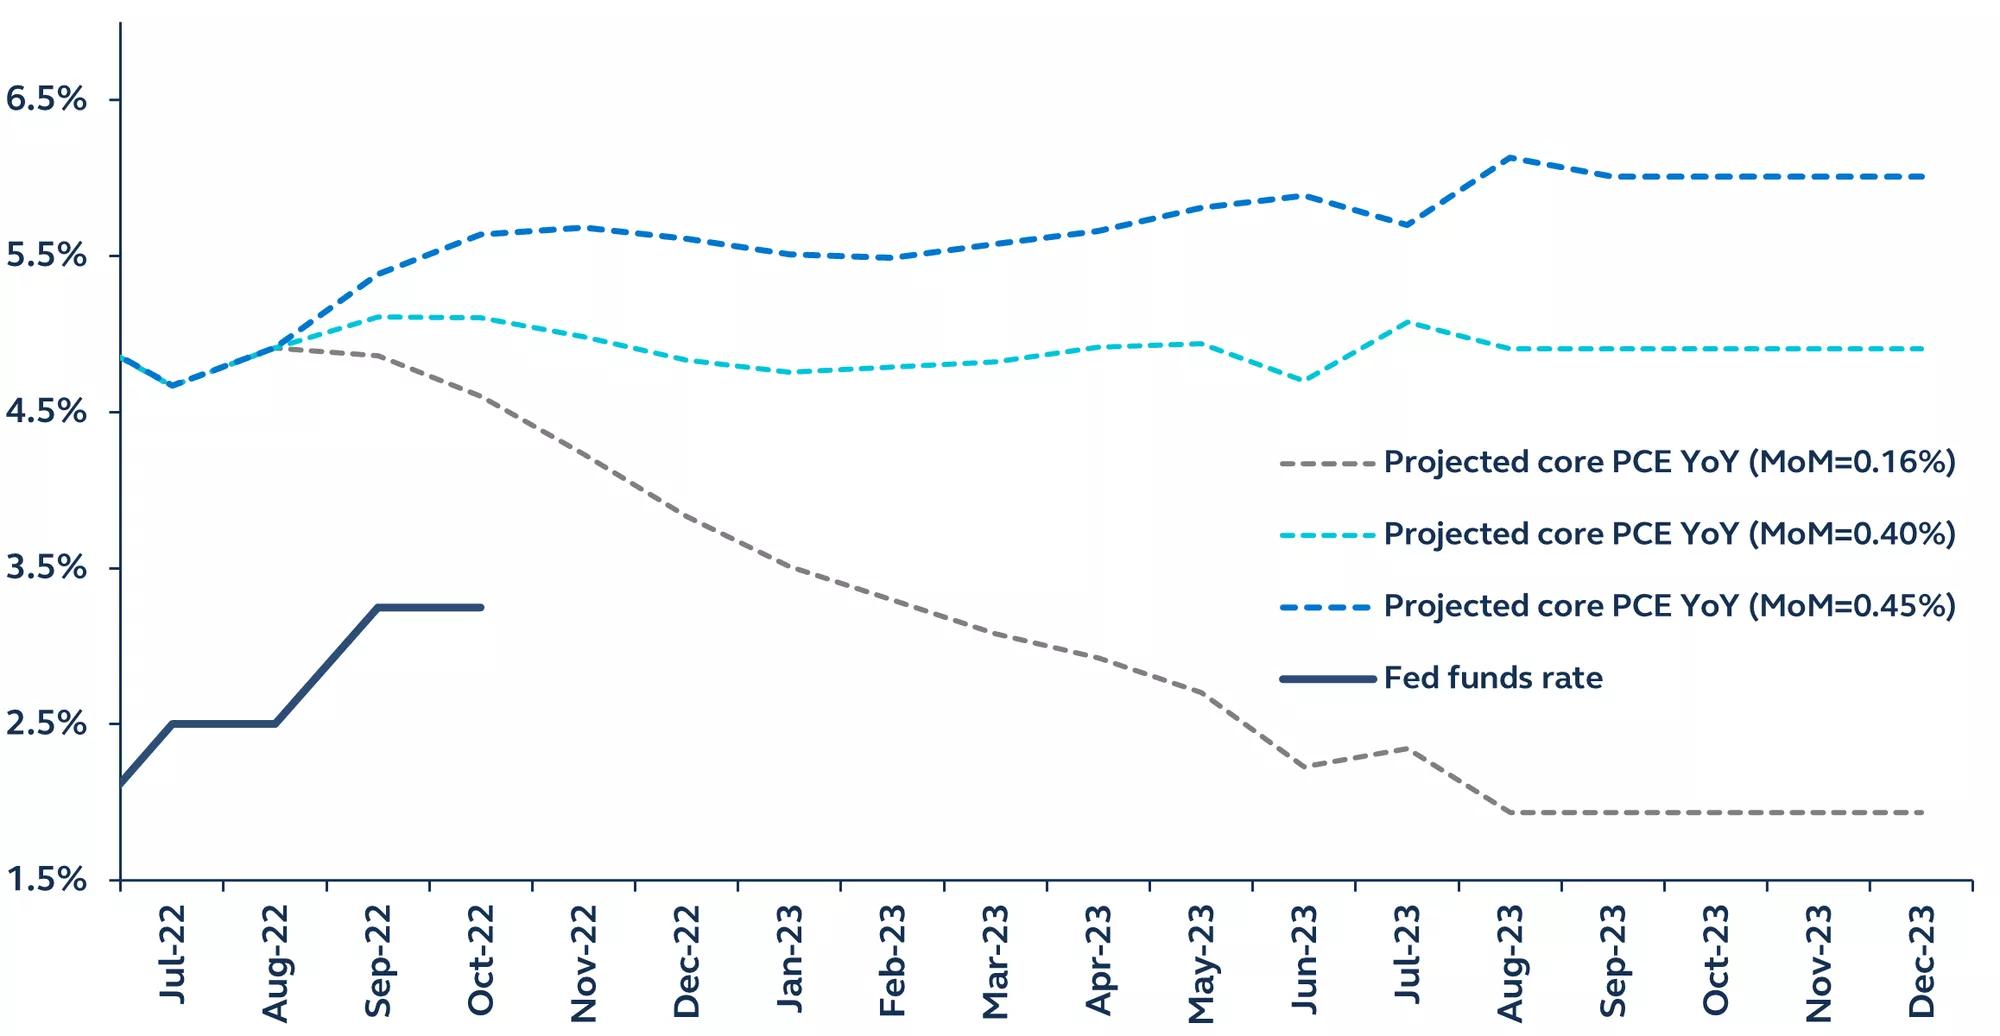
St. Louis Fed, Principal Asset Management. Data as of September 30, 2022.
Historical relationship between earnings and market drawdowns
In addition to Fed tightening, most bear markets have historically been associated with earnings drawdowns, particularly during recessions. In the 1960s and 70s, price drawdowns always preceded earnings drawdowns by several months, which increasingly looks like the 2022 bear market with the growing earnings risks for 2023. The 1980s and 90s did not follow any observable pattern, and in the 2000s, earnings and price drawdowns almost always happened concurrently. In most cases, markets tend to hit their floor before earnings troughed.
Expected 2023 U.S. earnings have recently been revised lower, and, with growing recession risks on the horizon, likely still have further room to be revised lower yet. However, the historical experience suggests that the market might bottom out before earnings do, particularly if inflation cools enough to allow an early 2023 pause in Fed rate hikes.
Peak-trough drawdowns greater than 10%
S&P 500 Index, earnings-per-share, 1965–present
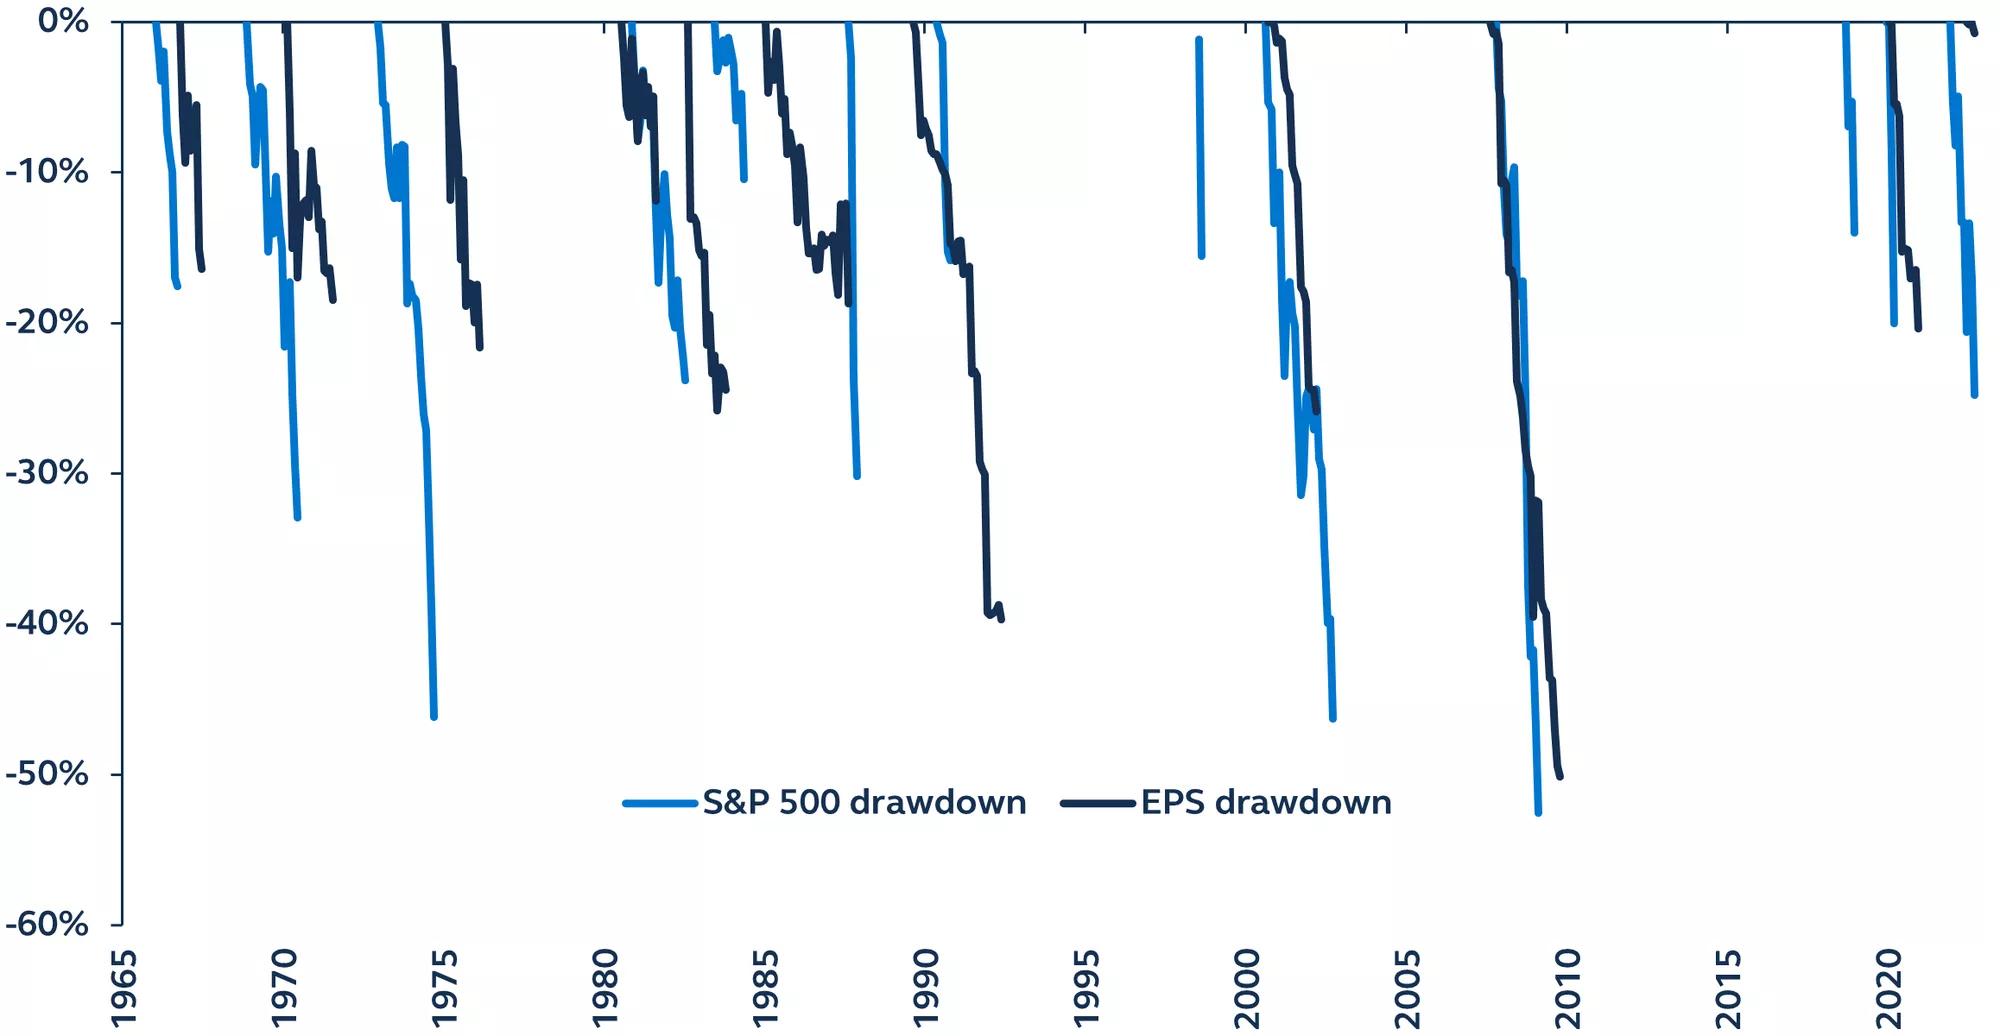
Bloomberg, Principal Asset Management. Data as of September 30, 2022.
So, when will the market bottom? After the Fed peaks
In the most probable scenario—one where inflation continues to cool, albeit slowly, and imbalances remain considerably more benign than during the GFC—the current market drawdown is likely more than halfway through, with another 5–10% fall likely still to come. As we have not yet reached the peak for Fed rate hikes, it’s highly unlikely that we’ve already seen the bottom of this bear market, especially given the history of Fed rate hikes peaking before the market troughs. We anticipate the market floor for this cycle will most likely be reached in Q1 or Q2 of 2023, with markets then rallying even as economic and earnings data deteriorate.
In the interim, we expect both market and inflation volatility to persist alongside further Fed rate hikes in Q4 2022, and into early 2023. Investors should remain defensive and screen their positions for high- quality characteristics until the macro clouds sufficiently clear and the Fed signals the end of its hiking cycle. With a 25% decline already behind us, this is not a time for investors to be selling out. Instead, start sifting through the ashes of the current bear market, be ready to deploy portfolio liquidity to capitalize on potential opportunities, and remain nimble to take advantage of any market recovery, once it comes.
Risk considerations
Investing involves risk, including possible loss of principal. Past performance is no guarantee of future results.
Important Information
This material covers general information only and does not take account of any investor’s investment objectives or financial situation and should not be construed as specific investment advice, a recommendation, or be relied on in any way as a guarantee, promise, forecast or prediction of future events regarding an investment or the markets in general. The opinions and predictions expressed are subject to change without prior notice. The information presented has been derived from sources believed to be accurate; however, we do not independently verify or guarantee its accuracy or validity. Any reference to a specific investment or security does not constitute a recommendation to buy, sell, or hold such investment or security, nor an indication that the investment manager or its affiliates has recommended a specific security for any client account. Subject to any contrary provisions of applicable law, the investment manager and its affiliates, and their officers, directors, employees, agents, disclaim any express or implied warranty of reliability or accuracy and any responsibility arising in any way (including by reason of negligence) for errors or omissions in the information or data provided.
This material may contain ‘forward-looking’ information that is not purely historical in nature and may include, among other things, projections and forecasts. There is no guarantee that any forecasts made will come to pass. Reliance upon information in this material is at the sole discretion of the reader.
This material is not intended for distribution to or use by any person or entity in any jurisdiction or country where such distribution or use would be contrary to local law or regulation.
This document is intent for use in:
- The United States by Principal Global Investors, LLC, which is regulated by the U.S. Securities and Exchange Commission.
- Europe by Principal Global Investors (EU) Limited, Sobo Works, Windmill Lane, Dublin D02 K156, Ireland. Principal Global Investors (EU) Limited is regulated by the Central Bank of Ireland. In Europe, this document is directed exclusively at Professional Clients and Eligible Counterparties and should not be relied upon by Retail Clients (all as defined by the MiFID). The contents of the document have been approved by the relevant entity. Clients that do not directly contract with Principal Global Investors (Europe) Limited (“PGIE”) or Principal Global Investors (EU) Limited (“PGI EU”) will not benefit from the protections offered by the rules and regulations of the Financial Conduct Authority or the Central Bank of Ireland, including those enacted under MiFID II. Further, where clients do contract with PGIE or PGI EU, PGIE or PGI EU may delegate management authority to affiliates that are not authorized and regulated within Europe and in any such case, the client may not benefit from all protections offered by the rules and regulations of the Financial Conduct Authority ,or the Central Bank of Ireland.
- United Kingdom by Principal Global Investors (Europe) Limited, Level 1, 1 Wood Street, London, EC2V 7 JB, registered in England, No. 03819986, which is authorized and regulated by the Financial Conduct Authority ("FCA").
- United Arab Emirates by Principal Global Investors LLC, a branch registered in the Dubai International Financial Centre and authorized by the Dubai Financial Services Authority as a representative office and is delivered on an individual basis to the recipient and should not be passed on or otherwise distributed by the recipient to any other person or organization.
- Singapore by Principal Global Investors (Singapore)Limited (ACRA Reg. No. 199603735H), which is regulated by the Monetary Authority of Singapore and is directed exclusively at institutional investors as defined by the Securities and Futures Act 2001. This advertisement or publication has not been reviewed by the Monetary Authority of Singapore.
- Australia by Principal Global Investors (Australia) Limited (ABN 45 102 488 068, AFS License No. 225385), which is regulated by the Australian Securities and Investments Commission. This document is intended for sophisticated institutional investors only.
- This document is marketing material and is issued in Switzerland by Principal Global Investors (Switzerland) GmbH.
- Hong Kong SAR (China) by Principal Global Investors (Hong Kong) Limited, which is regulated by the Securities and Futures Commission and is directed exclusively at professional investors as defined by the Securities and Futures Ordinance.
- Other APAC Countries, this material is issued for institutional investors only (or professional/sophisticated/qualified investors, as such term may apply in local jurisdictions) and is delivered on an individual basis to the recipient and should not be passed on, used by any person or entity in any jurisdiction or country where such distribution or use would be contrary to local law or regulation.
- Nothing in this document is, and shall not be considered as, an offer of financial products or services in Brazil. This presentation has been prepared for informational purposes only and is intended only for the designated recipients hereof. Principal Global Investors is not a Brazilian financial institution and is not licensed to and does not operate as a financial institution in Brazil.
Insurance products and plan administrative services provided through Principal Life Insurance Co. Principal Funds, Inc. is distributed by Principal Funds Distributor, Inc. Securities are offered through Principal Securities, Inc., 800 547-7754, Member SIPC and/or independent broker/dealers. Principal Life, Principal Funds Distributor, Inc., and Principal Securities are members of the Principal Financial Group®, Des Moines, IA50392.
© 2022, Principal Financial Services, Inc. Principal Asset ManagementSM is a trade name of Principal Global Investors, LLC. Principal®, Principal Financial Group®, Principal Asset Management, and Principal and the logomark design are registered trademarks and service marks of Principal Financial Services, Inc., a Principal Financial Group company, in various countries around the world and may be used only with the permission of Principal Financial Services, Inc
MM13129 | 2526805


