The quality profile of the high yield sector has slowly improved over the last decade, and now, high yield index quality is at a record high. Consequently, despite spreads only being near their 10-year average, the improved credit quality and a solid fundamental backdrop may represent an attractive entry point to the asset class.

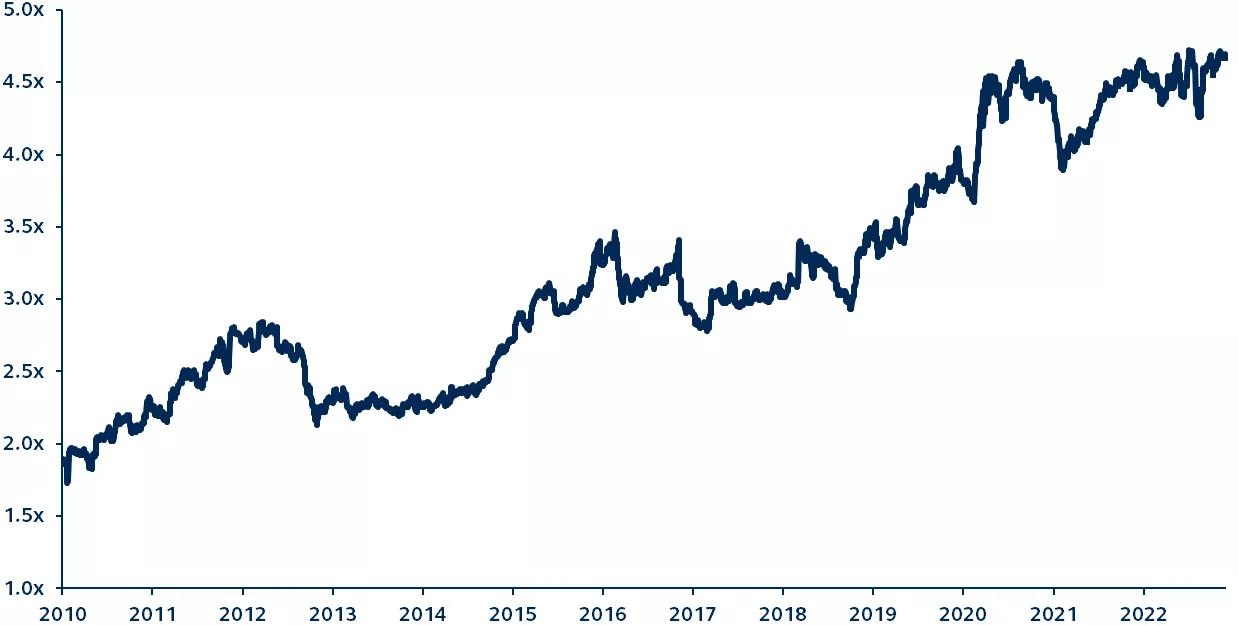
U.S. high yield market BB/CCC ratio
Bloomberg U.S. High Yield Index, 2010–present

Bloomberg, Principal Fixed Income. Data as of December 1, 2022.
Over the last 10 years the credit quality profile of the high yield market has progressively improved. Since 2010, the BB to CCC ratio has nearly tripled to over 4.5x today, resulting in a record high index quality. Therefore, even though current spreads are near the 2010–2022 average of 468, today actually represents an attractive entry point into the market given its improved credit quality.
Historically, investors have used high yield (HY) vs. investment grade (IG) spreads to help determine relative value—but the changes in credit quality indicate a need for investors to rethink this traditional reference point. As high yield credit quality has improved, investment grade has deteriorated, with the share of BBB rated bonds in the Bloomberg U.S. Corporate Investment Grade Bond Index increasing from under 40% ten years ago, to around 50% today. So, the current investor sentiment that IG vs. HY spreads are rich is actually misguided, and the spread is reasonably reflective of the convergence of index quality.
Today’s HY market is one of fundamental strength, with an increasing level of secured bonds, near record interest coverage ratios, and low default rates informing a positive view of the asset class. Although further volatility is to be expected, given the strong fundamental backdrop and a historically strong credit quality, high yield can present an immense value for investors today.
Investing involves risk, including possible loss of principal. Past performance is no guarantee of future results and should not be relied upon to make an investment decision. Lower-rated securities are subject to additional credit and default risks.
The information presented has been derived from sources believed to be accurate; however, we do not independently verify or guarantee its accuracy or validity. Any reference to a specific investment or security does not constitute a recommendation to buy, sell, or hold such investment or security, and does not take account of any investor’s investment objectives or financial situation and should not be construed as specific investment advice, a recommendation, or be relied on in any way as a guarantee, promise, forecast or prediction of future events regarding an investment or the markets in general. The opinions and predictions expressed are subject to change without prior notice.
Principal Funds, Inc. is distributed by Principal Funds Distributor, Inc.
For Public Distribution in the U.S. For Institutional, Professional, Qualified and/or Wholesale Investor Use only in other permitted jurisdictions as defined by local laws and regulations.
© 2022, Principal Financial Services, Inc. Principal Asset ManagementSM is a trade name of Principal Global Investors, LLC. Principal®, Principal Financial Group®, Principal Asset Management, and Principal and the logomark design are registered trademarks and service marks of Principal Financial Services, Inc., a Principal Financial Group company, in various countries around the world and may be used only with the permission of Principal Financial Services, Inc.
Principal Asset Management leads global asset management at Principal.®
2619594