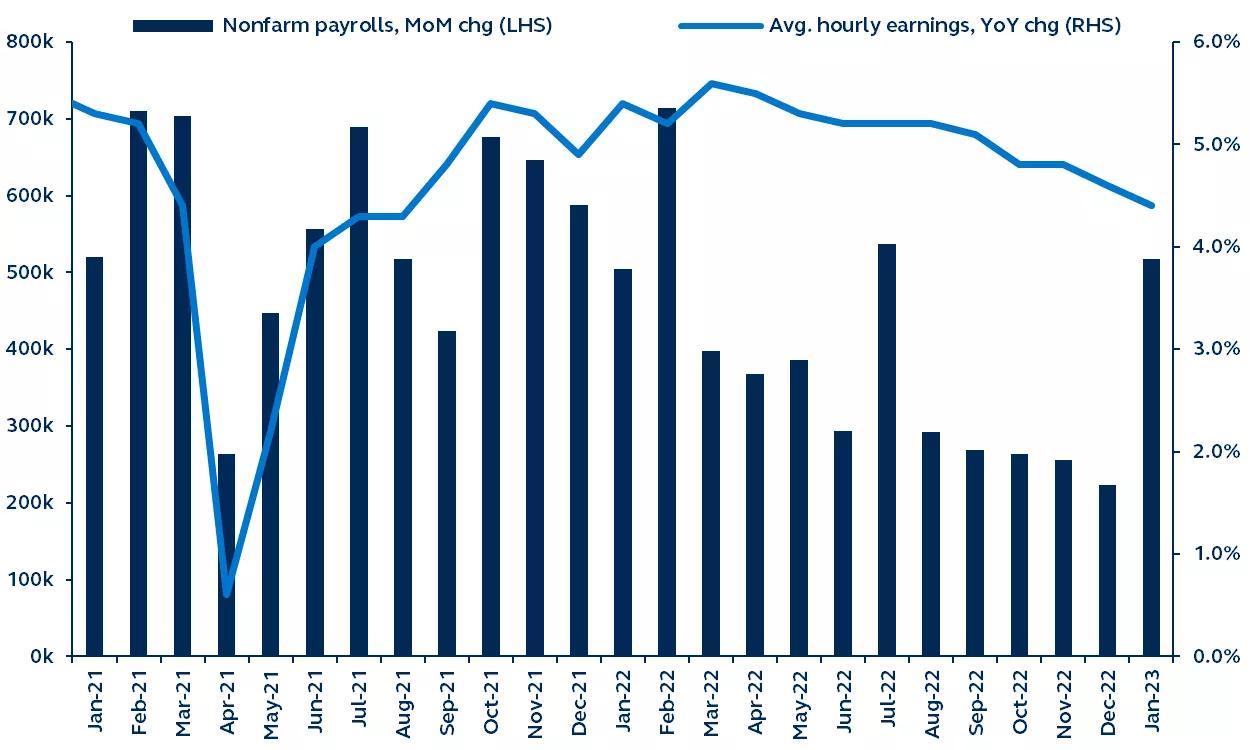
Today’s jobs report blew all the forecasts out of the water, with a monstrous 517,000 new jobs added in January. The unemployment rate is now down to 3.4%, suggestive of an extraordinarily tight labor market. While this is undoubtedly positive for the U.S. economy in the short-term, the Federal Reserve (Fed) has to be wondering how wage pressures can possibly soften sufficiently when jobs growth is as strong as it is. The Fed still has their work cut out for them—more rate hikes to come.

Report details:
- Job gains increased by 517,000 in January, up from (an upwardly revised) 260,000 in December. Not only was this meaningfully higher than the consensus forecast for 188,000, it was meaningfully higher than the highest forecast! Consider that, pre-COVID, a payroll number of 200,000 would have been considered representative of a very solid labor market, further illustrating the strength of today’s number. In turn, the unemployment rate fell from 3.5% to 3.4%, the lowest since 1969.
- The participation rate nudged up from 62.3% to 62.4%. The fact that the unemployment rate dropped even despite the rise in participation emphasizes the continued strength of labor demand.
- From a sector perspective, job gains were broad-based but were led by leisure and hospitality. That sector added the most jobs since September, primarily in restaurants and bars, suggesting that, to date, the consumer has remained very resilient despite monetary tightening. The manufacturing sector added its most jobs since October of last year, a surprise given that the sector has been contracting for the past few months. Additionally, construction added 25,000 jobs despite the housing market slowdown. At the other end of the spectrum, information services (which includes technology) unsurprisingly saw job losses in January.
- Unlike the payroll numbers, earnings growth was broadly in line with expectations. Average hourly earnings growth rose 0.3% month-on-month, down from an upwardly revised 0.4% in December, and the annual rate softened from 4.6% to 4.4%. While average hourly earnings growth has moderated from the highs of early 2022, it is well above the 3% pace that is considered consistent with 2% inflation.
- Average weekly hours worked “jumped” from 34.3 to 34.7, its highest level since March of last year. In recent months, hours worked had been declining steadily to pre-pandemic levels—considered a potential a signal of slowing labor demand. However, the rise in hours worked in January should put a stop to that narrative.
Nonfarm payrolls and average hourly earnings
2021–present

Bureau of Labor Statistics, Bloomberg, Principal Asset Management. Data as of February 3, 2023.
Financial markets celebrated following the FOMC decision on Wednesday, when Chair Powell failed to push back on market expectations for rate cuts later this year. However, with today’s data, it’s difficult to see the Fed halting rate increases and entertaining ideas of rate cuts when there are such volatile economic readings coming in.
The market is going to go through a rollercoaster ride as it tries to decide if this is good or bad news. For now, though, three things are abundantly clear: The U.S. labor market is in good health, the immediate recession risk is very low, and more monetary tightening is required.
Investing involves risk, including possible loss of principal. Past performance is no guarantee of future results.
Views and opinions expressed are accurate as of the date of this communication and are subject to change without notice. This material may contain ‘forward-looking’ information that is not purely historical in nature and may include, among other things, projections and forecasts. There is no guarantee that any forecasts made will come to pass. Reliance upon information in this material is at the sole discretion of the reader.
The information in the article should not be construed as investment advice or a recommendation for the purchase or sale of any security. The general information it contains does not take account of any investor’s investment objectives, particular needs, or financial situation.
For Public Distribution in the U.S. For Institutional, Professional, Qualified and/or Wholesale Investor Use Only in other Permitted Jurisdictions as defined by local laws and regulations.
2720064