Home Insights Real estate America’s housing opportunity: Beyond the supply gap
page assignment hero

Executive summary

Three themes define the U.S. housing market today:

  1. Rentership remains a cornerstone at approximately 35% of households,
  2. The rental market extends well beyond apartments, and
  3. The central challenge is not simply undersupply, but a mismatch between the types and locations of housing and where demand exists.

Rentership remains a cornerstone of housing

Since 1964, the U.S. homeownership rate according to the U.S. Census Bureau (as of 2Q 2025) has averaged 65.2%, peaking at 69.2% in 2004 and bottoming at 63% in 2016. Today, it sits near 65%, broadly in line with its long-term average. Looking ahead, we expect ownership and rentership to remain balanced: affordability barriers will continue to limit access to ownership, while demographic shifts (particularly among people aged 25–54 and 70+) should provide steady but modest support for demand. Over the long run, homeownership is therefore likely to remain anchored around 65%.

Rentership is broader than apartments

Apartments are only part of the rental story. According to National Multifamily Housing Council (NMHC), just 39% of renters live in buildings with five or more units, while a comparable share rent single-family homes. Another 17% occupy two-to-four-unit properties, and 4% live in manufactured housing. Regional and geographic differences are material: manufactured housing represents 13% of rentals in non-metropolitan areas, for example. Some demand is also understated in headline data. Independent living for seniors counts as rentership, but assisted living, nursing homes, and dormitories, which are significant sources of demand tied to aging and student populations, are excluded.

Yes, there is a housing shortage…but also mismatch

Headlines often cite a housing shortage of millions of units and while the underproduction is real, the framing is incomplete. First, the nationwide gap is almost entirely concentrated among extremely low-income households, but other income groups have adequate housing. The housing affordability challenges are especially acute in eight major metros, but many other markets remain affordable for the median earner. Second, the even greater issue is misalignment: our analysis of U.S. Census data for household formations (demand) and household completions (supply) from 2013 to 2023 at the state, CBSA and county level suggests that very few markets have an oversupply problem in aggregate, but rather many markets are challenged with undersupply. Since most new supply skews towards Class A units, it’s possible that some markets that appear balanced have an oversupply of conventional Class A house, but an under-supply of affordable housing.

Bottom line

The U.S. rental market is highly fragmented. Regional variations in housing types, the split between multifamily and single-family rentals, and the role of manufactured housing all shape supply. The core challenge is not simply the number of homes, but whether they are in the right places, of the right type, and at prices households can afford. There is not an optimal nationwide solution making market and housing type selection critical. Addressing these dynamics therefore requires a holistic approach that spans the full rental spectrum—critical for policymakers, investors, and housing providers alike.

Beyond headlines: Understanding housing affordability

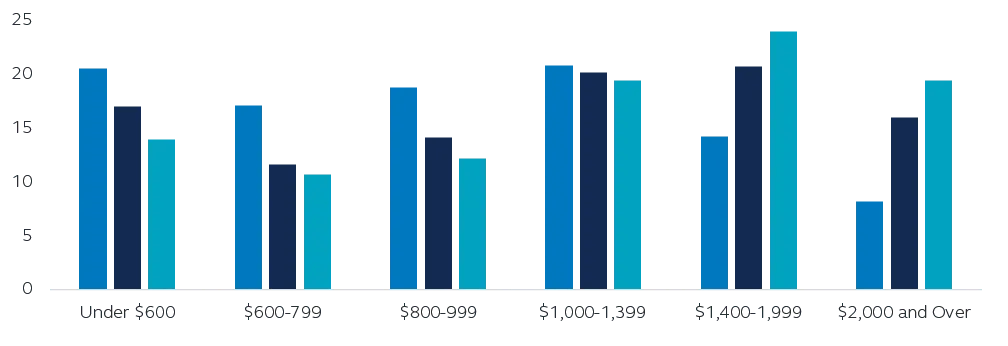
It may surprise some people to learn that the cost to build a Class A apartment isn’t that different than Class B, C or even affordable (see The cost of affordable housing: Does it pencil out?). This is because the cost of land, labor, materials, and regulatory compliance are essentially the same whether the property will be considered Class A or B. That means a new building must command top-of-market rents to producing compelling returns. The Housing Affordability Toolkit produced by the NMHC provides a helpful analysis of the cost drivers of building apartments. Properties “filter down” the quality spectrum as they age without ongoing reinvestment in the property. As a result, the percentage of apartments at lower rent levels is steadily declining over time.

State–Share of Rental Units by Monthly Contract Rent: 2013, 2019, and 2023

Share of Rental Units by Monthly Contract Rent (Percent)

Chart showing that the percentage of apartments at lower rent levels is steadily declining over time
From left to right:
 
2013
 
2019
 
2023


Source: Joint Center for Housing Studies, U.S. Census Bureau, American Community Survey 1-Year Estimates, 2024.

The exception is essential housing and manufactured housing. Some developers target the essential housing space by building smaller, simpler properties with fewer amenities to keep rents lower. Furthermore, manufactured housing typically serves as essential housing in more rural areas. That’s exactly why only 4% of renters live in manufactured housing nationwide, but it rises to 13% of rentals in non-metropolitan areas.

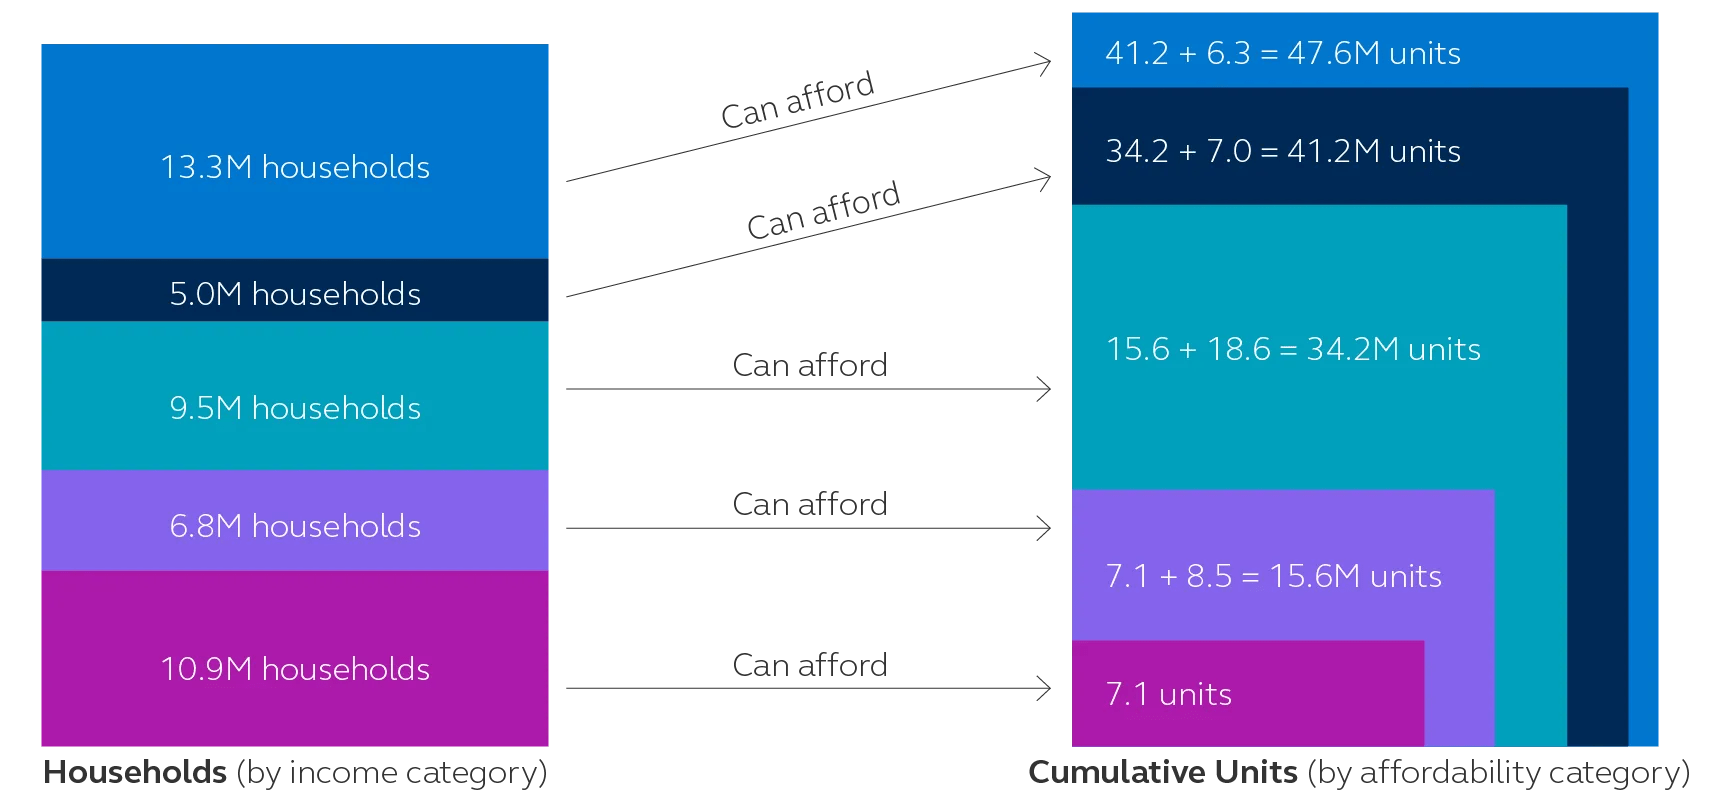
While the prevailing narrative is that the U.S. faces a shortage of affordable housing as a result, the reality is that the problem is concentrated among extremely low-income households. The National Low Income Housing Coalition state in their report titled The Gap: A Shortage of Affordable Homes that “the nation’s 10.9 million extremely low-income renter households face a shortage of 7.1 million affordable and available rental homes, resulting in only 35 affordable and available homes for every 100 extremely low-income renter households”. By contrast, all other income groups have sufficient affordable rental housing available to meet their needs.

Middle-income renters: About 5 million households (81%–100% of AMI) can access the homes affordable to low-income renters plus 7 million higher-cost units, for a total of 41.2 million units.

Low-income renters: Roughly 9.5 million households (51%–80% of AMI) can access 15.6 million units available to extremely low- and very low-income renters, plus 18.6 million higher-cost rentals, totaling 34.2 million units.

Very low-income renters: Over 6.8 million households (50% of AMI or below) can access 7.1 million units affordable to extremely low-income renters plus 8.5 million additional units, totaling 15.6 million. Combined with extremely low-income households, 17.7 million renters compete for only 15.6 million units, creating a shortfall of roughly 2.1 million homes.

Rental units and renters in the U.S. matched by affordability and income categories, 2023 (in millions)

From top to bottom:
 
Extremely low-income
 
Very low-income
 
Low-income
 
Middle-income
 
Above median income
 Charts showing the nation’s 10.9 million extremely low-income renter households face a shortage of 7.1 million affordable

Source: Source: National Low Income Housing Coalition, 2023 ACS PUMS
Note the numbers are rounded and therefore may not exactly add up to the final cumulative total of households and/or rental units.

Affordable housing challenges exist nationwide, impacting communities in every state, but they are especially acute in certain markets. According to Zillow, in eight major metros—San Francisco, San Jose, Los Angeles, Riverside, San Diego, Miami, New York, and Boston—renters now need six-figure incomes to comfortably afford rent. In six of these markets, the median household would spend over 30% of its income on a typical rental. San Jose and San Francisco are somewhat exceptions, where median households would spend 25% and 28% of income on rent, respectively. Despite significant rent increases over the past five years, many markets remain affordable for median earners. The most budget-friendly metros include Buffalo ($55K income required), Oklahoma City ($56K), and Louisville ($57K), where median renters would spend 23% or less of their income on rent, providing more flexibility for financial stability.

Conclusion

The U.S. housing market is shaped less by an overall shortage of units and more by a persistent mismatch between the types and locations of housing and the evolving needs of households. Rentership, which accounts for roughly 35% of households, is a central feature, but it extends far beyond the traditional Class A apartments that dominate new construction, encompassing single-family rental homes, manufactured housing, and even senior as well as student living options. Across U.S. housing markets, some cities cater effectively to middle-income households but offer limited options for lower-income renters, while others prioritize affordability at the lower end, leaving fewer opportunities for the middle tier. This makes an optimal nationwide solution elusive and suggests that understanding local market dynamics is critical. Targeted policies and investments that align new supply with actual demand, both in terms of housing type and location, are essential to building a more balanced, accessible, and resilient housing system for all Americans.

For our full analysis of the three themes defining the U.S. housing market today, please download the report.

Real estate
Disclosure

For Public Distribution in the U.S. For Institutional, Professional, Qualified and/or Wholesale
Investor Use Only in other Permitted Jurisdictions as defined by local laws and regulations.

Risk Considerations
Investing involves risk, including possible loss of principal. Past Performance does not guarantee future return. All financial investments involve an element of risk. Therefore, the value of the investment and the income from it will vary and the initial investment amount cannot be guaranteed. Potential investors should be aware of the risks inherent to owning and investing in real estate, including value fluctuations, capital market pricing volatility, liquidity risks, leverage, credit risk, occupancy risk and legal risk. All these risks can lead to a decline in the value of the real estate, a decline in the income produced by the real estate and declines in the value or total loss in value of securities derived from investments in real estate. International investing involves greater risks such as currency fluctuations, political/social instability, and differing accounting standards.

Important information
This material covers general information only and does not take account of any investor’s investment objectives or financial situation and should not be construed as specific investment advice, a recommendation, or be relied on in any way as a guarantee, promise, forecast or prediction of future events regarding an investment or the markets in general. The opinions and predictions expressed are subject to change without prior notice. The information presented has been derived from sources believed to be accurate; however, we do not independently verify or guarantee its accuracy or validity. Any reference to a specific investment or security does not constitute a recommendation to buy, sell, or hold such investment or security, nor an indication that the investment manager or its affiliates has recommended a specific security for any client account.

Subject to any contrary provisions of applicable law, the investment manager and its affiliates, and their officers, directors, employees, agents, disclaim any express or implied warranty of reliability or accuracy and any responsibility arising in any way (including by reason of negligence) for errors or omissions in the information or data provided. All figures shown in this document are in U.S. dollars unless otherwise noted.

This material may contain ‘forward looking’ information that is not purely historical in nature. Such information may include, among other things, projections and forecasts. There is no guarantee that any forecasts made will come to pass. Reliance upon information in this material is at the sole discretion of the reader.

This material is not intended for distribution to or use by any person or entity in any jurisdiction or country where such distribution or use would be contrary to local law or regulation.

This document is issued in:

  • The United States by Principal Global Investors, LLC, which is regulated by the U.S. Securities and Exchange Commission.
  • Europe by Principal Global Investors (Ireland) Limited, 70 Sir John Rogerson’s Quay, Dublin 2, D02 R296, Ireland. Principal Global Investors (Ireland) Limited is regulated by the Central Bank of Ireland. Clients that do not directly contract with Principal Global Investors (Europe) Limited (“PGIE”) or Principal Global Investors (Ireland) Limited (“PGII”) will not benefit from the protections offered by the rules and regulations of the Financial Conduct Authority or the Central Bank of Ireland, including those enacted under MiFID II. Further, where clients do contract with PGIE or PGII, PGIE or PGII may delegate management authority to affiliates that are not authorised and regulated within Europe and in any such case, the client may not benefit from all protections offered by the rules and regulations of the Financial Conduct Authority, or the Central Bank of Ireland. In Europe, this document is directed exclusively at Professional Clients and Eligible Counterparties and should not be relied upon by Retail Clients (all as defined by the MiFID).
  • United Kingdom by Principal Global Investors (Europe) Limited, Level 1, 1 Wood Street, London, EC2V 7 JB, registered in England, No.03819986, which is authorized and regulated by the Financial Conduct Authority (“FCA”).
  • United Arab Emirates by Principal Investor Management (DIFC) Limited, an entity registered in the Dubai International Financial Centre and authorized by the Dubai Financial Services Authority as an Authorized Firm, in its capacity as distributor / promoter of the products and services of Principal Asset Management. This document is delivered on an individual basis to the recipient and should not be passed on or otherwise distributed by the recipient to any other person or organization.
  • Singapore by Principal Global Investors (Singapore) Limited (ACRA Reg. No. 199603735H), which is regulated by the Monetary Authority of Singapore and is directed exclusively at institutional investors as defined by the Securities and Futures Act 2001. This advertisement or publication has not been reviewed by the Monetary Authority of Singapore.
  • Australia by Principal Global Investors (Australia) Limited (ABN 45 102 488 068, AFS Licence No. 225385), which is regulated by the Australian Securities and Investments Commission and is only directed at wholesale clients as defined under Corporations Act 2001.
  • This document is marketing material and is issued in Switzerland by Principal Global Investors (Switzerland) GmbH.
  • Hong Kong SAR by Principal Asset Management Company (Asia) Limited, which is regulated by the Securities and Futures Commission. This document has not been reviewed by the Securities and Futures Commission. This document may only be distributed, circulated or issued to persons who are Professional Investors under the Securities and Futures Ordinance and any rules made under that Ordinance or as otherwise permitted by that Ordinance.
  • Other APAC Countries/Jurisdictions, this material is issued for institutional investors only (or professional/sophisticated/qualified investors, as such term may apply in local jurisdictions) and is delivered on an individual basis to the recipient and should not be passed on, used by any person or entity in any jurisdiction or country where such distribution or use would be contrary to local law or regulation.

Principal Global Investors, LLC (PGI) is registered with the U.S. Commodity Futures Trading Commission (CFTC) as a commodity trading advisor (CTA), a commodity pool operator (CPO) and is a member of the National Futures Association (NFA). PGI advises qualified eligible persons (QEPs) under CFTC Regulation 4.7.

Principal Funds are distributed by Principal Funds Distributor, Inc.

©2025 Principal Financial Services, Inc. Principal®, Principal Financial Group®, Principal Asset Management, and Principal and the logomark design are registered trademarks and service marks of Principal Financial Services, Inc., a Principal Financial Group company, in various countries around the world and may be used only with the permission of Principal Financial Services, Inc. Principal Asset Management is a trade name of Principal Global Investors, LLC. Principal Real Estate is a trade name of Principal Real Estate Investors, LLC, an affiliate of Principal Global Investors.

MM14715 | 10/2025 | 4849491 - 122026

About the author